French American Indian vs Mexican American Indian 11th Grade
COMPARE
French American Indian
Mexican American Indian
11th Grade
11th Grade Comparison
French American Indians
Mexican American Indians
92.3%
11TH GRADE
30.8/ 100
METRIC RATING
191st/ 347
METRIC RANK
87.5%
11TH GRADE
0.0/ 100
METRIC RATING
329th/ 347
METRIC RANK
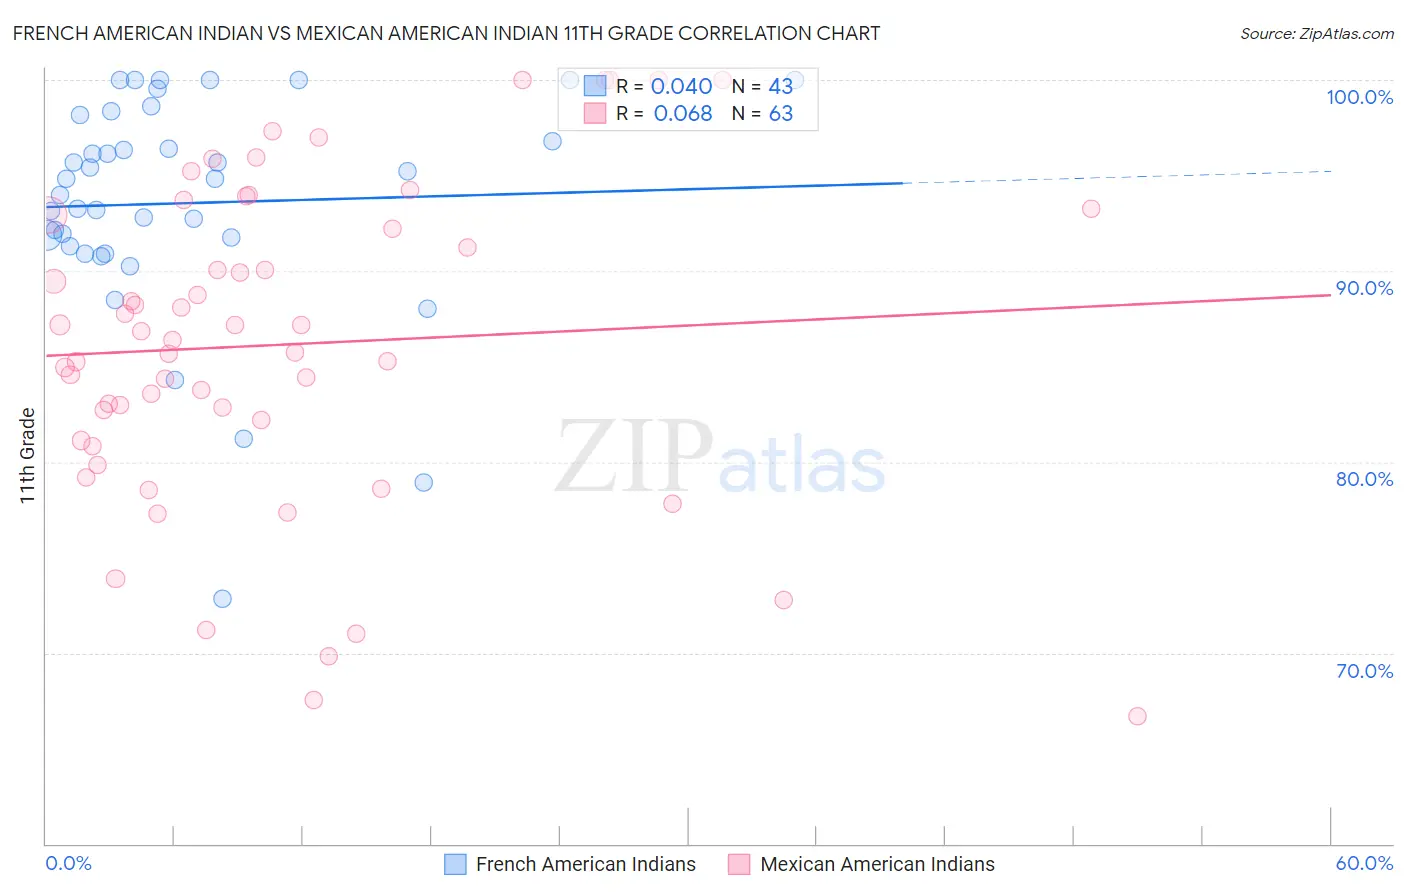
French American Indian vs Mexican American Indian 11th Grade Correlation Chart
The statistical analysis conducted on geographies consisting of 131,976,269 people shows no correlation between the proportion of French American Indians and percentage of population with at least 11th grade education in the United States with a correlation coefficient (R) of 0.040 and weighted average of 92.3%. Similarly, the statistical analysis conducted on geographies consisting of 317,621,155 people shows a slight positive correlation between the proportion of Mexican American Indians and percentage of population with at least 11th grade education in the United States with a correlation coefficient (R) of 0.068 and weighted average of 87.5%, a difference of 5.5%.
11th Grade Correlation Summary
| Measurement | French American Indian | Mexican American Indian |
| Minimum | 72.9% | 66.7% |
| Maximum | 100.0% | 100.0% |
| Range | 27.1% | 33.3% |
| Mean | 93.6% | 86.1% |
| Median | 94.8% | 86.4% |
| Interquartile 25% (IQ1) | 91.3% | 81.1% |
| Interquartile 75% (IQ3) | 98.2% | 93.0% |
| Interquartile Range (IQR) | 6.9% | 11.8% |
| Standard Deviation (Sample) | 5.9% | 8.3% |
| Standard Deviation (Population) | 5.8% | 8.3% |
Similar Demographics by 11th Grade
Demographics Similar to French American Indians by 11th Grade
In terms of 11th grade, the demographic groups most similar to French American Indians are Immigrants from Syria (92.3%, a difference of 0.0%), Chickasaw (92.3%, a difference of 0.010%), Moroccan (92.3%, a difference of 0.020%), Immigrants from Indonesia (92.4%, a difference of 0.030%), and Immigrants from Chile (92.4%, a difference of 0.030%).
| Demographics | Rating | Rank | 11th Grade |
| Immigrants | Asia | 37.4 /100 | #184 | Fair 92.4% |
| Immigrants | Nepal | 36.4 /100 | #185 | Fair 92.4% |
| Arapaho | 35.1 /100 | #186 | Fair 92.4% |
| Immigrants | Western Asia | 35.0 /100 | #187 | Fair 92.4% |
| Immigrants | Indonesia | 33.7 /100 | #188 | Fair 92.4% |
| Immigrants | Chile | 33.3 /100 | #189 | Fair 92.4% |
| Chickasaw | 31.4 /100 | #190 | Fair 92.3% |
| French American Indians | 30.8 /100 | #191 | Fair 92.3% |
| Immigrants | Syria | 30.4 /100 | #192 | Fair 92.3% |
| Moroccans | 28.7 /100 | #193 | Fair 92.3% |
| Sioux | 28.5 /100 | #194 | Fair 92.3% |
| Liberians | 26.8 /100 | #195 | Fair 92.3% |
| Panamanians | 26.4 /100 | #196 | Fair 92.3% |
| Marshallese | 26.0 /100 | #197 | Fair 92.3% |
| Hawaiians | 25.5 /100 | #198 | Fair 92.3% |
Demographics Similar to Mexican American Indians by 11th Grade
In terms of 11th grade, the demographic groups most similar to Mexican American Indians are Tohono O'odham (87.6%, a difference of 0.070%), Immigrants from Cabo Verde (87.6%, a difference of 0.13%), Dominican (87.7%, a difference of 0.15%), Honduran (87.4%, a difference of 0.19%), and Hispanic or Latino (87.3%, a difference of 0.25%).
| Demographics | Rating | Rank | 11th Grade |
| Puerto Ricans | 0.0 /100 | #322 | Tragic 88.4% |
| Pima | 0.0 /100 | #323 | Tragic 88.3% |
| Central American Indians | 0.0 /100 | #324 | Tragic 88.2% |
| Immigrants | Nicaragua | 0.0 /100 | #325 | Tragic 88.1% |
| Dominicans | 0.0 /100 | #326 | Tragic 87.7% |
| Immigrants | Cabo Verde | 0.0 /100 | #327 | Tragic 87.6% |
| Tohono O'odham | 0.0 /100 | #328 | Tragic 87.6% |
| Mexican American Indians | 0.0 /100 | #329 | Tragic 87.5% |
| Hondurans | 0.0 /100 | #330 | Tragic 87.4% |
| Hispanics or Latinos | 0.0 /100 | #331 | Tragic 87.3% |
| Immigrants | Azores | 0.0 /100 | #332 | Tragic 87.2% |
| Immigrants | Yemen | 0.0 /100 | #333 | Tragic 87.1% |
| Houma | 0.0 /100 | #334 | Tragic 87.0% |
| Central Americans | 0.0 /100 | #335 | Tragic 86.9% |
| Immigrants | Dominican Republic | 0.0 /100 | #336 | Tragic 86.9% |