French American Indian vs Immigrants from Micronesia Householder Income Ages 45 - 64 years
COMPARE
French American Indian
Immigrants from Micronesia
Householder Income Ages 45 - 64 years
Householder Income Ages 45 - 64 years Comparison
French American Indians
Immigrants from Micronesia
$89,811
HOUSEHOLDER INCOME AGES 45 - 64 YEARS
0.5/ 100
METRIC RATING
256th/ 347
METRIC RANK
$87,864
HOUSEHOLDER INCOME AGES 45 - 64 YEARS
0.2/ 100
METRIC RATING
268th/ 347
METRIC RANK
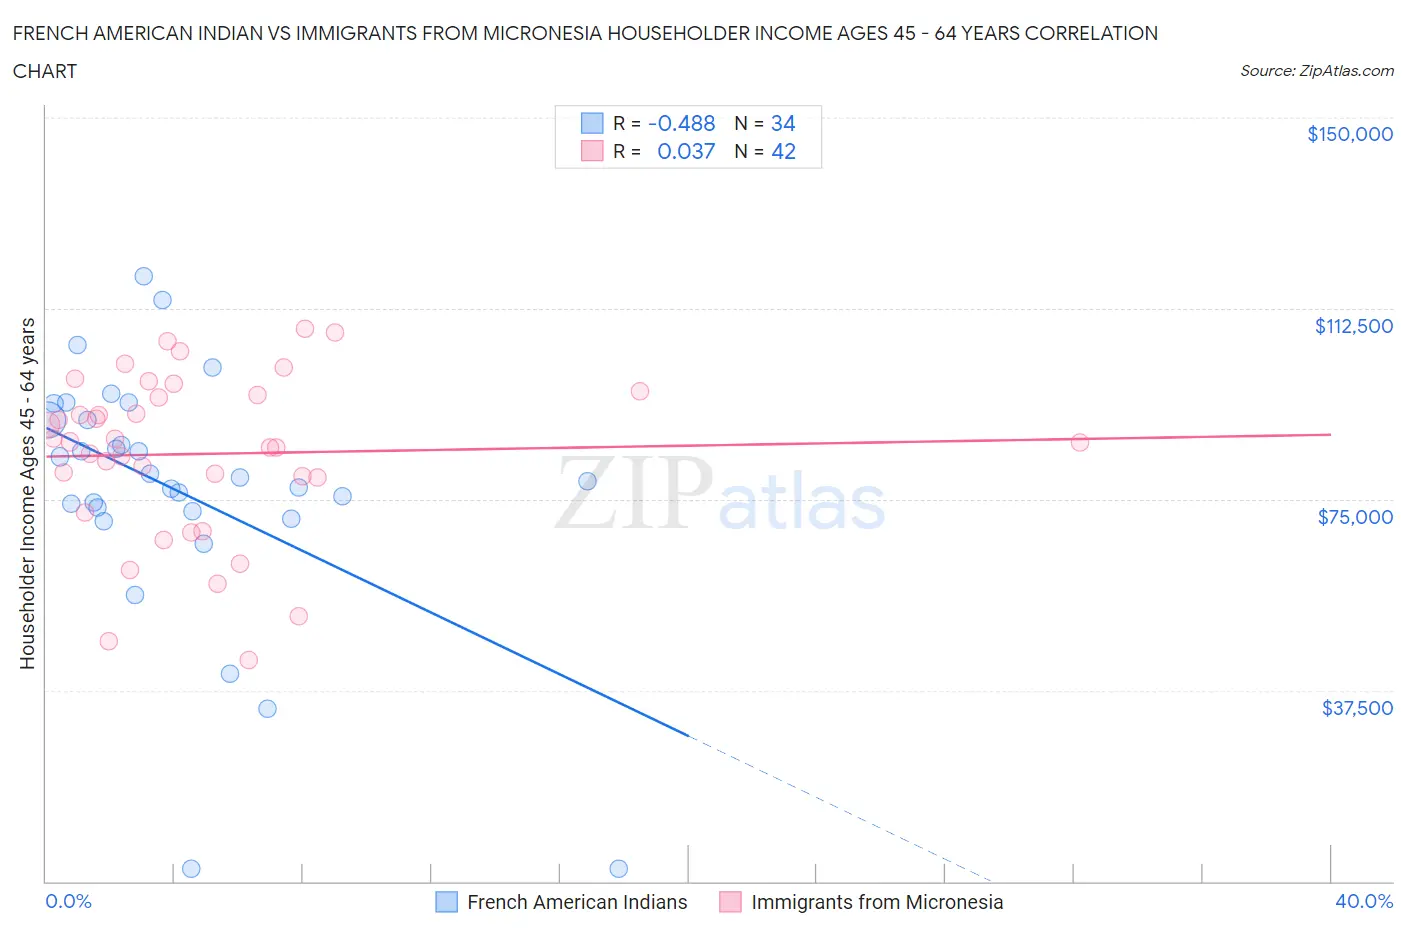
French American Indian vs Immigrants from Micronesia Householder Income Ages 45 - 64 years Correlation Chart
The statistical analysis conducted on geographies consisting of 131,896,651 people shows a moderate negative correlation between the proportion of French American Indians and household income with householder between the ages 45 and 64 in the United States with a correlation coefficient (R) of -0.488 and weighted average of $89,811. Similarly, the statistical analysis conducted on geographies consisting of 61,565,628 people shows no correlation between the proportion of Immigrants from Micronesia and household income with householder between the ages 45 and 64 in the United States with a correlation coefficient (R) of 0.037 and weighted average of $87,864, a difference of 2.2%.
Householder Income Ages 45 - 64 years Correlation Summary
| Measurement | French American Indian | Immigrants from Micronesia |
| Minimum | $2,499 | $43,523 |
| Maximum | $118,854 | $108,482 |
| Range | $116,355 | $64,959 |
| Mean | $76,575 | $83,933 |
| Median | $78,869 | $86,276 |
| Interquartile 25% (IQ1) | $72,546 | $79,375 |
| Interquartile 75% (IQ3) | $90,690 | $95,598 |
| Interquartile Range (IQR) | $18,144 | $16,223 |
| Standard Deviation (Sample) | $25,412 | $16,111 |
| Standard Deviation (Population) | $25,035 | $15,918 |
Demographics Similar to French American Indians and Immigrants from Micronesia by Householder Income Ages 45 - 64 years
In terms of householder income ages 45 - 64 years, the demographic groups most similar to French American Indians are West Indian ($89,906, a difference of 0.11%), Immigrants from Guyana ($90,186, a difference of 0.42%), German Russian ($89,398, a difference of 0.46%), Immigrants from Barbados ($89,394, a difference of 0.47%), and Barbadian ($90,266, a difference of 0.51%). Similarly, the demographic groups most similar to Immigrants from Micronesia are Spanish American ($87,836, a difference of 0.030%), Immigrants from Liberia ($87,739, a difference of 0.14%), Guatemalan ($87,705, a difference of 0.18%), Hmong ($88,115, a difference of 0.29%), and Cape Verdean ($87,580, a difference of 0.32%).
| Demographics | Rating | Rank | Householder Income Ages 45 - 64 years |
| Marshallese | 0.7 /100 | #252 | Tragic $90,455 |
| Barbadians | 0.6 /100 | #253 | Tragic $90,266 |
| Immigrants | Guyana | 0.6 /100 | #254 | Tragic $90,186 |
| West Indians | 0.5 /100 | #255 | Tragic $89,906 |
| French American Indians | 0.5 /100 | #256 | Tragic $89,811 |
| German Russians | 0.4 /100 | #257 | Tragic $89,398 |
| Immigrants | Barbados | 0.4 /100 | #258 | Tragic $89,394 |
| Immigrants | Nicaragua | 0.4 /100 | #259 | Tragic $89,108 |
| Liberians | 0.3 /100 | #260 | Tragic $88,929 |
| Belizeans | 0.3 /100 | #261 | Tragic $88,684 |
| Somalis | 0.3 /100 | #262 | Tragic $88,600 |
| Immigrants | Senegal | 0.3 /100 | #263 | Tragic $88,421 |
| Osage | 0.3 /100 | #264 | Tragic $88,390 |
| Jamaicans | 0.2 /100 | #265 | Tragic $88,327 |
| Immigrants | West Indies | 0.2 /100 | #266 | Tragic $88,164 |
| Hmong | 0.2 /100 | #267 | Tragic $88,115 |
| Immigrants | Micronesia | 0.2 /100 | #268 | Tragic $87,864 |
| Spanish Americans | 0.2 /100 | #269 | Tragic $87,836 |
| Immigrants | Liberia | 0.2 /100 | #270 | Tragic $87,739 |
| Guatemalans | 0.2 /100 | #271 | Tragic $87,705 |
| Cape Verdeans | 0.2 /100 | #272 | Tragic $87,580 |