Finnish vs Immigrants from Fiji 4th Grade
COMPARE
Finnish
Immigrants from Fiji
4th Grade
4th Grade Comparison
Finns
Immigrants from Fiji
98.3%
4TH GRADE
100.0/ 100
METRIC RATING
22nd/ 347
METRIC RANK
95.8%
4TH GRADE
0.0/ 100
METRIC RATING
330th/ 347
METRIC RANK
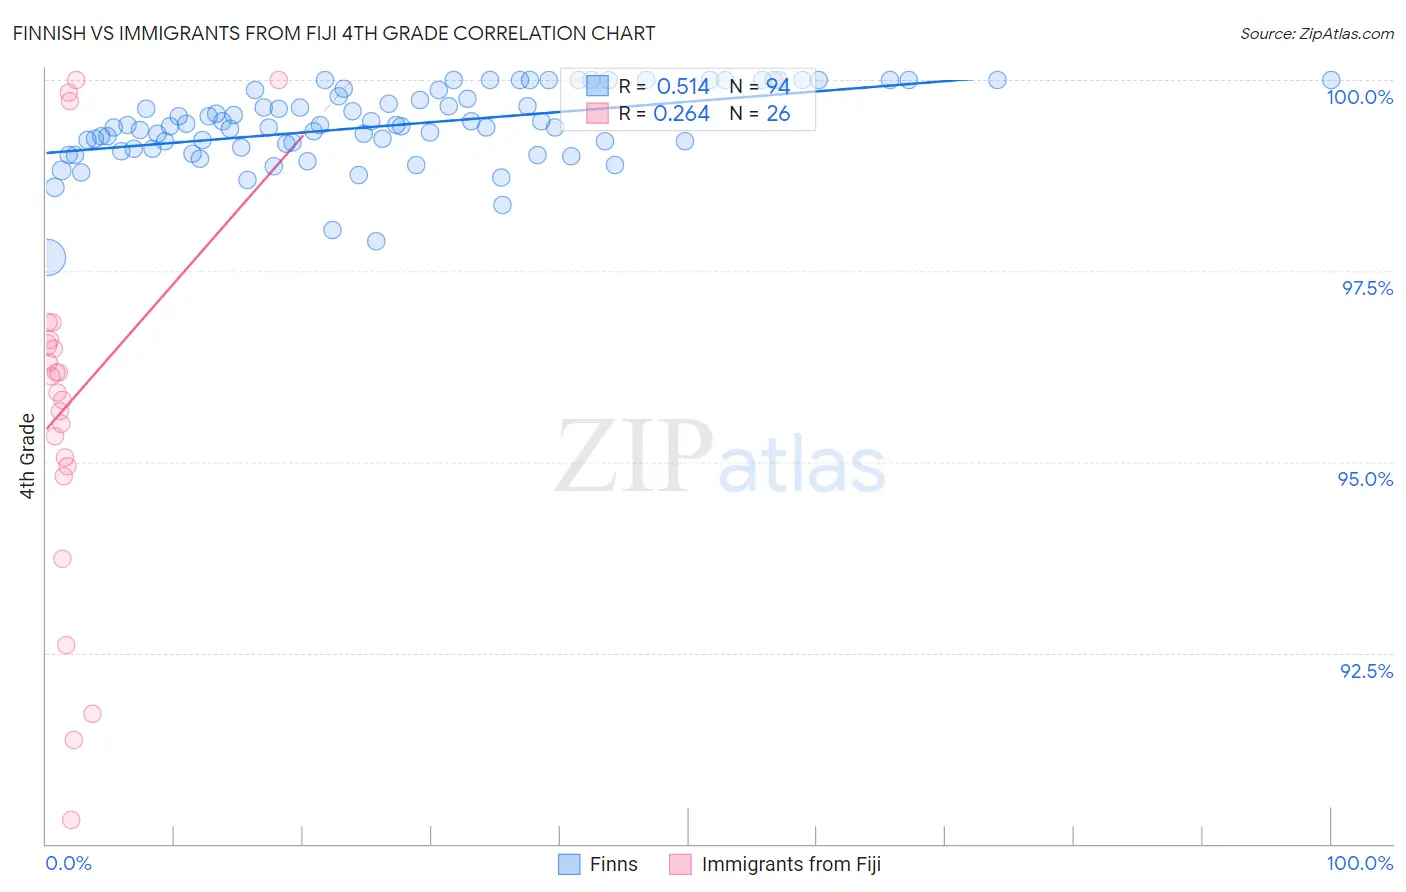
Finnish vs Immigrants from Fiji 4th Grade Correlation Chart
The statistical analysis conducted on geographies consisting of 404,675,516 people shows a substantial positive correlation between the proportion of Finns and percentage of population with at least 4th grade education in the United States with a correlation coefficient (R) of 0.514 and weighted average of 98.3%. Similarly, the statistical analysis conducted on geographies consisting of 93,756,204 people shows a weak positive correlation between the proportion of Immigrants from Fiji and percentage of population with at least 4th grade education in the United States with a correlation coefficient (R) of 0.264 and weighted average of 95.8%, a difference of 2.6%.
4th Grade Correlation Summary
| Measurement | Finnish | Immigrants from Fiji |
| Minimum | 97.7% | 90.3% |
| Maximum | 100.0% | 100.0% |
| Range | 2.3% | 9.7% |
| Mean | 99.4% | 95.8% |
| Median | 99.4% | 96.0% |
| Interquartile 25% (IQ1) | 99.1% | 94.9% |
| Interquartile 75% (IQ3) | 99.9% | 96.6% |
| Interquartile Range (IQR) | 0.75% | 1.7% |
| Standard Deviation (Sample) | 0.50% | 2.5% |
| Standard Deviation (Population) | 0.49% | 2.4% |
Similar Demographics by 4th Grade
Demographics Similar to Finns by 4th Grade
In terms of 4th grade, the demographic groups most similar to Finns are Lithuanian (98.3%, a difference of 0.0%), Alaska Native (98.4%, a difference of 0.010%), Sioux (98.3%, a difference of 0.010%), Polish (98.4%, a difference of 0.020%), and Irish (98.4%, a difference of 0.020%).
| Demographics | Rating | Rank | 4th Grade |
| Dutch | 100.0 /100 | #15 | Exceptional 98.4% |
| Scottish | 100.0 /100 | #16 | Exceptional 98.4% |
| Pennsylvania Germans | 100.0 /100 | #17 | Exceptional 98.4% |
| Poles | 100.0 /100 | #18 | Exceptional 98.4% |
| Irish | 100.0 /100 | #19 | Exceptional 98.4% |
| Alaska Natives | 100.0 /100 | #20 | Exceptional 98.4% |
| Lithuanians | 100.0 /100 | #21 | Exceptional 98.3% |
| Finns | 100.0 /100 | #22 | Exceptional 98.3% |
| Sioux | 100.0 /100 | #23 | Exceptional 98.3% |
| Danes | 100.0 /100 | #24 | Exceptional 98.3% |
| Scotch-Irish | 100.0 /100 | #25 | Exceptional 98.3% |
| Croatians | 100.0 /100 | #26 | Exceptional 98.3% |
| French Canadians | 100.0 /100 | #27 | Exceptional 98.3% |
| French | 100.0 /100 | #28 | Exceptional 98.3% |
| Czechs | 100.0 /100 | #29 | Exceptional 98.3% |
Demographics Similar to Immigrants from Fiji by 4th Grade
In terms of 4th grade, the demographic groups most similar to Immigrants from Fiji are Immigrants from Cambodia (95.8%, a difference of 0.0%), Mexican American Indian (95.8%, a difference of 0.020%), Immigrants from Armenia (95.8%, a difference of 0.050%), Immigrants from Honduras (95.8%, a difference of 0.060%), and Immigrants from Dominican Republic (95.7%, a difference of 0.11%).
| Demographics | Rating | Rank | 4th Grade |
| Immigrants | Nicaragua | 0.0 /100 | #323 | Tragic 96.0% |
| Immigrants | Belize | 0.0 /100 | #324 | Tragic 96.0% |
| Dominicans | 0.0 /100 | #325 | Tragic 96.0% |
| Hispanics or Latinos | 0.0 /100 | #326 | Tragic 96.0% |
| Hondurans | 0.0 /100 | #327 | Tragic 96.0% |
| Mexican American Indians | 0.0 /100 | #328 | Tragic 95.8% |
| Immigrants | Cambodia | 0.0 /100 | #329 | Tragic 95.8% |
| Immigrants | Fiji | 0.0 /100 | #330 | Tragic 95.8% |
| Immigrants | Armenia | 0.0 /100 | #331 | Tragic 95.8% |
| Immigrants | Honduras | 0.0 /100 | #332 | Tragic 95.8% |
| Immigrants | Dominican Republic | 0.0 /100 | #333 | Tragic 95.7% |
| Immigrants | Cabo Verde | 0.0 /100 | #334 | Tragic 95.7% |
| Immigrants | Latin America | 0.0 /100 | #335 | Tragic 95.7% |
| Mexicans | 0.0 /100 | #336 | Tragic 95.6% |
| Central Americans | 0.0 /100 | #337 | Tragic 95.5% |