Finnish vs Immigrants from Fiji Seniors Poverty Over the Age of 65
COMPARE
Finnish
Immigrants from Fiji
Seniors Poverty Over the Age of 65
Seniors Poverty Over the Age of 65 Comparison
Finns
Immigrants from Fiji
9.4%
SENIORS POVERTY OVER THE AGE OF 65
99.8/ 100
METRIC RATING
31st/ 347
METRIC RANK
11.0%
SENIORS POVERTY OVER THE AGE OF 65
42.0/ 100
METRIC RATING
182nd/ 347
METRIC RANK
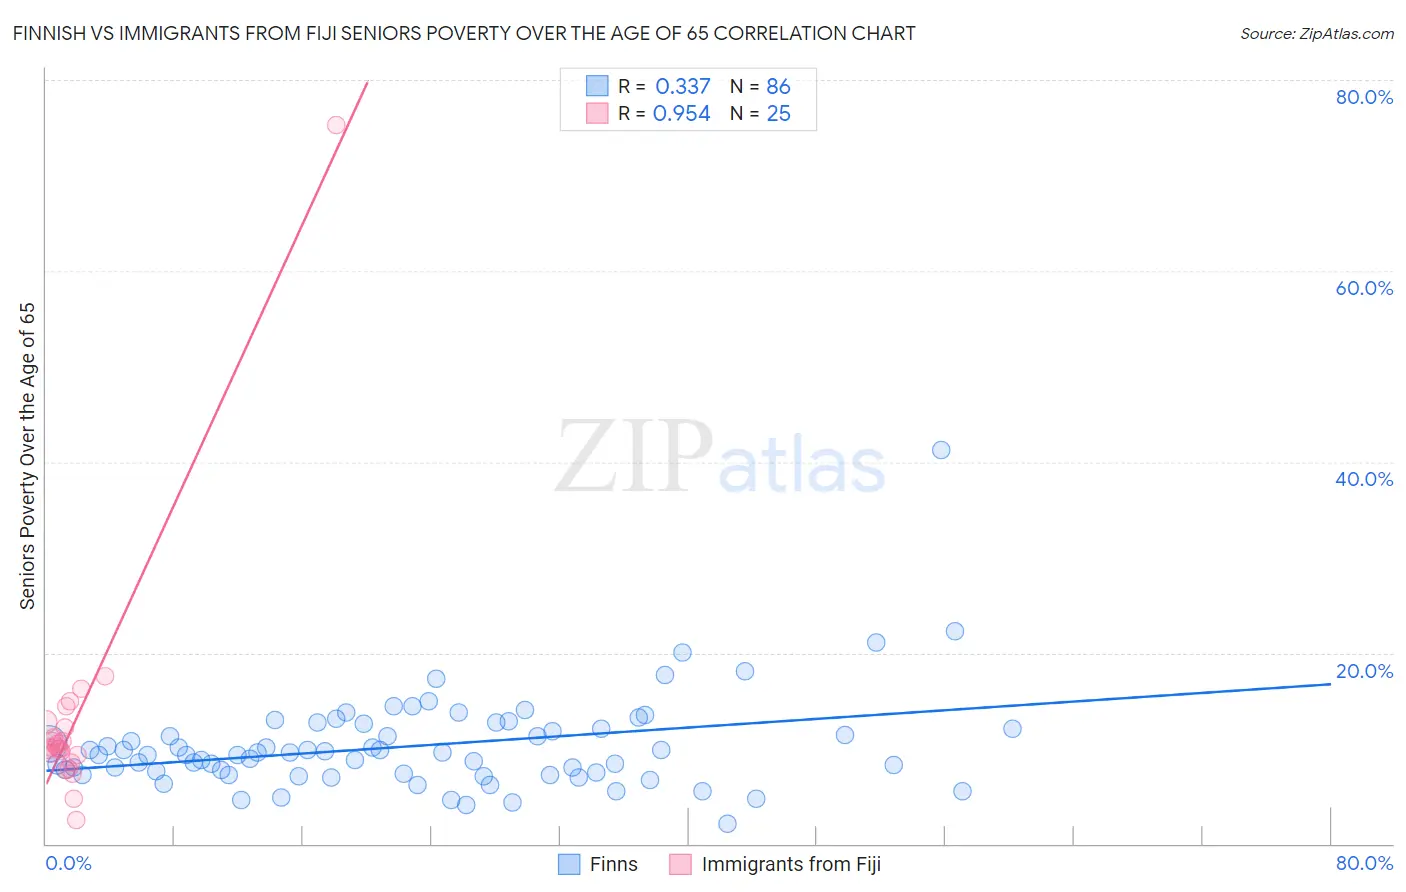
Finnish vs Immigrants from Fiji Seniors Poverty Over the Age of 65 Correlation Chart
The statistical analysis conducted on geographies consisting of 403,117,006 people shows a mild positive correlation between the proportion of Finns and poverty level among seniors over the age of 65 in the United States with a correlation coefficient (R) of 0.337 and weighted average of 9.4%. Similarly, the statistical analysis conducted on geographies consisting of 93,720,826 people shows a perfect positive correlation between the proportion of Immigrants from Fiji and poverty level among seniors over the age of 65 in the United States with a correlation coefficient (R) of 0.954 and weighted average of 11.0%, a difference of 17.4%.
Seniors Poverty Over the Age of 65 Correlation Summary
| Measurement | Finnish | Immigrants from Fiji |
| Minimum | 2.1% | 2.5% |
| Maximum | 41.3% | 75.3% |
| Range | 39.2% | 72.8% |
| Mean | 10.3% | 12.9% |
| Median | 9.4% | 10.1% |
| Interquartile 25% (IQ1) | 7.4% | 8.9% |
| Interquartile 75% (IQ3) | 12.1% | 12.5% |
| Interquartile Range (IQR) | 4.7% | 3.6% |
| Standard Deviation (Sample) | 5.1% | 13.4% |
| Standard Deviation (Population) | 5.1% | 13.1% |
Similar Demographics by Seniors Poverty Over the Age of 65
Demographics Similar to Finns by Seniors Poverty Over the Age of 65
In terms of seniors poverty over the age of 65, the demographic groups most similar to Finns are Menominee (9.4%, a difference of 0.22%), Northern European (9.4%, a difference of 0.28%), Native Hawaiian (9.4%, a difference of 0.30%), Bhutanese (9.3%, a difference of 0.37%), and British (9.4%, a difference of 0.40%).
| Demographics | Rating | Rank | Seniors Poverty Over the Age of 65 |
| Bulgarians | 99.9 /100 | #24 | Exceptional 9.3% |
| Irish | 99.9 /100 | #25 | Exceptional 9.3% |
| Immigrants | Scotland | 99.9 /100 | #26 | Exceptional 9.3% |
| Italians | 99.9 /100 | #27 | Exceptional 9.3% |
| Tongans | 99.9 /100 | #28 | Exceptional 9.3% |
| Bhutanese | 99.9 /100 | #29 | Exceptional 9.3% |
| Menominee | 99.8 /100 | #30 | Exceptional 9.4% |
| Finns | 99.8 /100 | #31 | Exceptional 9.4% |
| Northern Europeans | 99.8 /100 | #32 | Exceptional 9.4% |
| Native Hawaiians | 99.8 /100 | #33 | Exceptional 9.4% |
| British | 99.8 /100 | #34 | Exceptional 9.4% |
| Latvians | 99.8 /100 | #35 | Exceptional 9.5% |
| Czechoslovakians | 99.8 /100 | #36 | Exceptional 9.5% |
| Scotch-Irish | 99.7 /100 | #37 | Exceptional 9.5% |
| Belgians | 99.7 /100 | #38 | Exceptional 9.5% |
Demographics Similar to Immigrants from Fiji by Seniors Poverty Over the Age of 65
In terms of seniors poverty over the age of 65, the demographic groups most similar to Immigrants from Fiji are Immigrants from Kazakhstan (11.0%, a difference of 0.090%), Immigrants from France (11.0%, a difference of 0.10%), Immigrants from Thailand (11.0%, a difference of 0.13%), Immigrants from Eastern Africa (11.0%, a difference of 0.13%), and Immigrants from Northern Africa (11.0%, a difference of 0.23%).
| Demographics | Rating | Rank | Seniors Poverty Over the Age of 65 |
| Creek | 49.6 /100 | #175 | Average 10.9% |
| Immigrants | Malaysia | 47.9 /100 | #176 | Average 11.0% |
| Cherokee | 47.3 /100 | #177 | Average 11.0% |
| German Russians | 46.9 /100 | #178 | Average 11.0% |
| Immigrants | Northern Africa | 44.6 /100 | #179 | Average 11.0% |
| Immigrants | Thailand | 43.5 /100 | #180 | Average 11.0% |
| Immigrants | Eastern Africa | 43.4 /100 | #181 | Average 11.0% |
| Immigrants | Fiji | 42.0 /100 | #182 | Average 11.0% |
| Immigrants | Kazakhstan | 41.0 /100 | #183 | Average 11.0% |
| Immigrants | France | 40.9 /100 | #184 | Average 11.0% |
| Immigrants | Lebanon | 38.2 /100 | #185 | Fair 11.1% |
| Immigrants | Eastern Asia | 37.5 /100 | #186 | Fair 11.1% |
| Immigrants | Middle Africa | 37.4 /100 | #187 | Fair 11.1% |
| Immigrants | Hong Kong | 36.3 /100 | #188 | Fair 11.1% |
| Immigrants | Laos | 35.7 /100 | #189 | Fair 11.1% |