Armenian vs Immigrants from Fiji 4th Grade
COMPARE
Armenian
Immigrants from Fiji
4th Grade
4th Grade Comparison
Armenians
Immigrants from Fiji
97.0%
4TH GRADE
0.3/ 100
METRIC RATING
265th/ 347
METRIC RANK
95.8%
4TH GRADE
0.0/ 100
METRIC RATING
330th/ 347
METRIC RANK
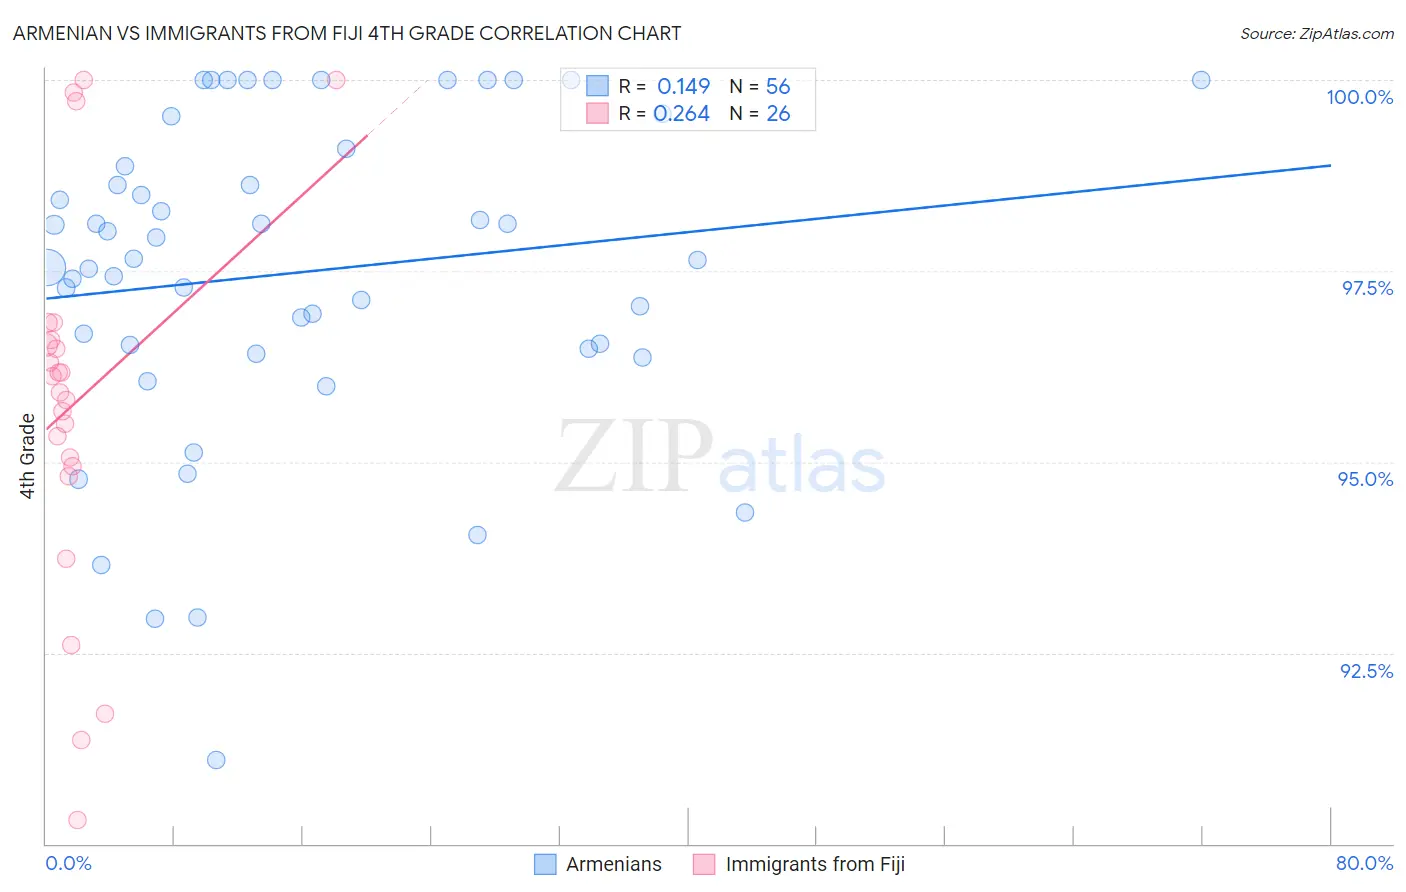
Armenian vs Immigrants from Fiji 4th Grade Correlation Chart
The statistical analysis conducted on geographies consisting of 310,954,660 people shows a poor positive correlation between the proportion of Armenians and percentage of population with at least 4th grade education in the United States with a correlation coefficient (R) of 0.149 and weighted average of 97.0%. Similarly, the statistical analysis conducted on geographies consisting of 93,756,204 people shows a weak positive correlation between the proportion of Immigrants from Fiji and percentage of population with at least 4th grade education in the United States with a correlation coefficient (R) of 0.264 and weighted average of 95.8%, a difference of 1.2%.
4th Grade Correlation Summary
| Measurement | Armenian | Immigrants from Fiji |
| Minimum | 91.1% | 90.3% |
| Maximum | 100.0% | 100.0% |
| Range | 8.9% | 9.7% |
| Mean | 97.5% | 95.8% |
| Median | 97.6% | 96.0% |
| Interquartile 25% (IQ1) | 96.5% | 94.9% |
| Interquartile 75% (IQ3) | 99.0% | 96.6% |
| Interquartile Range (IQR) | 2.5% | 1.7% |
| Standard Deviation (Sample) | 2.1% | 2.5% |
| Standard Deviation (Population) | 2.1% | 2.4% |
Similar Demographics by 4th Grade
Demographics Similar to Armenians by 4th Grade
In terms of 4th grade, the demographic groups most similar to Armenians are Taiwanese (97.0%, a difference of 0.0%), Immigrants from China (97.0%, a difference of 0.010%), Immigrants from Nigeria (97.0%, a difference of 0.010%), Immigrants from South America (97.0%, a difference of 0.020%), and West Indian (97.0%, a difference of 0.020%).
| Demographics | Rating | Rank | 4th Grade |
| Immigrants | Colombia | 0.5 /100 | #258 | Tragic 97.0% |
| Immigrants | Ethiopia | 0.4 /100 | #259 | Tragic 97.0% |
| Immigrants | Sierra Leone | 0.4 /100 | #260 | Tragic 97.0% |
| Immigrants | South America | 0.4 /100 | #261 | Tragic 97.0% |
| West Indians | 0.4 /100 | #262 | Tragic 97.0% |
| Immigrants | Jamaica | 0.3 /100 | #263 | Tragic 97.0% |
| Taiwanese | 0.3 /100 | #264 | Tragic 97.0% |
| Armenians | 0.3 /100 | #265 | Tragic 97.0% |
| Immigrants | China | 0.3 /100 | #266 | Tragic 97.0% |
| Immigrants | Nigeria | 0.3 /100 | #267 | Tragic 97.0% |
| Ghanaians | 0.2 /100 | #268 | Tragic 97.0% |
| Immigrants | Uzbekistan | 0.2 /100 | #269 | Tragic 96.9% |
| Cubans | 0.2 /100 | #270 | Tragic 96.9% |
| Immigrants | Peru | 0.1 /100 | #271 | Tragic 96.9% |
| Fijians | 0.1 /100 | #272 | Tragic 96.9% |
Demographics Similar to Immigrants from Fiji by 4th Grade
In terms of 4th grade, the demographic groups most similar to Immigrants from Fiji are Immigrants from Cambodia (95.8%, a difference of 0.0%), Mexican American Indian (95.8%, a difference of 0.020%), Immigrants from Armenia (95.8%, a difference of 0.050%), Immigrants from Honduras (95.8%, a difference of 0.060%), and Immigrants from Dominican Republic (95.7%, a difference of 0.11%).
| Demographics | Rating | Rank | 4th Grade |
| Immigrants | Nicaragua | 0.0 /100 | #323 | Tragic 96.0% |
| Immigrants | Belize | 0.0 /100 | #324 | Tragic 96.0% |
| Dominicans | 0.0 /100 | #325 | Tragic 96.0% |
| Hispanics or Latinos | 0.0 /100 | #326 | Tragic 96.0% |
| Hondurans | 0.0 /100 | #327 | Tragic 96.0% |
| Mexican American Indians | 0.0 /100 | #328 | Tragic 95.8% |
| Immigrants | Cambodia | 0.0 /100 | #329 | Tragic 95.8% |
| Immigrants | Fiji | 0.0 /100 | #330 | Tragic 95.8% |
| Immigrants | Armenia | 0.0 /100 | #331 | Tragic 95.8% |
| Immigrants | Honduras | 0.0 /100 | #332 | Tragic 95.8% |
| Immigrants | Dominican Republic | 0.0 /100 | #333 | Tragic 95.7% |
| Immigrants | Cabo Verde | 0.0 /100 | #334 | Tragic 95.7% |
| Immigrants | Latin America | 0.0 /100 | #335 | Tragic 95.7% |
| Mexicans | 0.0 /100 | #336 | Tragic 95.6% |
| Central Americans | 0.0 /100 | #337 | Tragic 95.5% |