Finnish vs Vietnamese 4th Grade
COMPARE
Finnish
Vietnamese
4th Grade
4th Grade Comparison
Finns
Vietnamese
98.3%
4TH GRADE
100.0/ 100
METRIC RATING
22nd/ 347
METRIC RANK
96.2%
4TH GRADE
0.0/ 100
METRIC RATING
314th/ 347
METRIC RANK
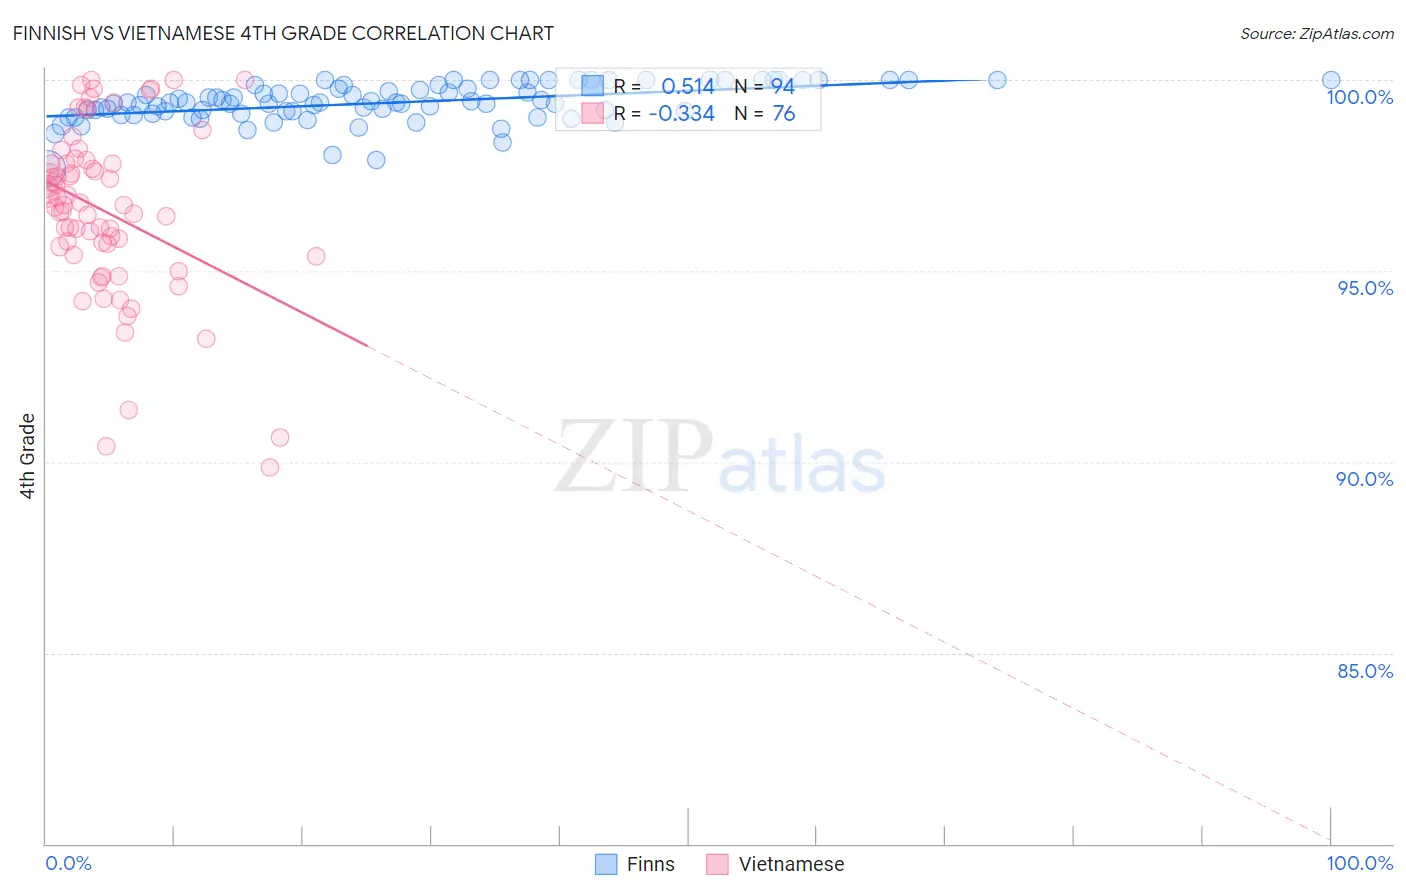
Finnish vs Vietnamese 4th Grade Correlation Chart
The statistical analysis conducted on geographies consisting of 404,675,516 people shows a substantial positive correlation between the proportion of Finns and percentage of population with at least 4th grade education in the United States with a correlation coefficient (R) of 0.514 and weighted average of 98.3%. Similarly, the statistical analysis conducted on geographies consisting of 170,726,780 people shows a mild negative correlation between the proportion of Vietnamese and percentage of population with at least 4th grade education in the United States with a correlation coefficient (R) of -0.334 and weighted average of 96.2%, a difference of 2.2%.
4th Grade Correlation Summary
| Measurement | Finnish | Vietnamese |
| Minimum | 97.7% | 89.8% |
| Maximum | 100.0% | 100.0% |
| Range | 2.3% | 10.2% |
| Mean | 99.4% | 96.6% |
| Median | 99.4% | 96.7% |
| Interquartile 25% (IQ1) | 99.1% | 95.5% |
| Interquartile 75% (IQ3) | 99.9% | 97.8% |
| Interquartile Range (IQR) | 0.75% | 2.3% |
| Standard Deviation (Sample) | 0.50% | 2.2% |
| Standard Deviation (Population) | 0.49% | 2.2% |
Similar Demographics by 4th Grade
Demographics Similar to Finns by 4th Grade
In terms of 4th grade, the demographic groups most similar to Finns are Lithuanian (98.3%, a difference of 0.0%), Alaska Native (98.4%, a difference of 0.010%), Sioux (98.3%, a difference of 0.010%), Polish (98.4%, a difference of 0.020%), and Irish (98.4%, a difference of 0.020%).
| Demographics | Rating | Rank | 4th Grade |
| Dutch | 100.0 /100 | #15 | Exceptional 98.4% |
| Scottish | 100.0 /100 | #16 | Exceptional 98.4% |
| Pennsylvania Germans | 100.0 /100 | #17 | Exceptional 98.4% |
| Poles | 100.0 /100 | #18 | Exceptional 98.4% |
| Irish | 100.0 /100 | #19 | Exceptional 98.4% |
| Alaska Natives | 100.0 /100 | #20 | Exceptional 98.4% |
| Lithuanians | 100.0 /100 | #21 | Exceptional 98.3% |
| Finns | 100.0 /100 | #22 | Exceptional 98.3% |
| Sioux | 100.0 /100 | #23 | Exceptional 98.3% |
| Danes | 100.0 /100 | #24 | Exceptional 98.3% |
| Scotch-Irish | 100.0 /100 | #25 | Exceptional 98.3% |
| Croatians | 100.0 /100 | #26 | Exceptional 98.3% |
| French Canadians | 100.0 /100 | #27 | Exceptional 98.3% |
| French | 100.0 /100 | #28 | Exceptional 98.3% |
| Czechs | 100.0 /100 | #29 | Exceptional 98.3% |
Demographics Similar to Vietnamese by 4th Grade
In terms of 4th grade, the demographic groups most similar to Vietnamese are Indonesian (96.2%, a difference of 0.0%), Nicaraguan (96.2%, a difference of 0.010%), Immigrants from Ecuador (96.2%, a difference of 0.010%), Cape Verdean (96.2%, a difference of 0.020%), and Immigrants from Bangladesh (96.2%, a difference of 0.030%).
| Demographics | Rating | Rank | 4th Grade |
| Immigrants | Haiti | 0.0 /100 | #307 | Tragic 96.3% |
| Immigrants | Laos | 0.0 /100 | #308 | Tragic 96.3% |
| Immigrants | Guyana | 0.0 /100 | #309 | Tragic 96.3% |
| Immigrants | Burma/Myanmar | 0.0 /100 | #310 | Tragic 96.3% |
| Immigrants | Bangladesh | 0.0 /100 | #311 | Tragic 96.2% |
| Cape Verdeans | 0.0 /100 | #312 | Tragic 96.2% |
| Indonesians | 0.0 /100 | #313 | Tragic 96.2% |
| Vietnamese | 0.0 /100 | #314 | Tragic 96.2% |
| Nicaraguans | 0.0 /100 | #315 | Tragic 96.2% |
| Immigrants | Ecuador | 0.0 /100 | #316 | Tragic 96.2% |
| Central American Indians | 0.0 /100 | #317 | Tragic 96.2% |
| Immigrants | Azores | 0.0 /100 | #318 | Tragic 96.1% |
| Belizeans | 0.0 /100 | #319 | Tragic 96.1% |
| Bangladeshis | 0.0 /100 | #320 | Tragic 96.1% |
| Japanese | 0.0 /100 | #321 | Tragic 96.0% |