Finnish vs Immigrants from Fiji 11th Grade
COMPARE
Finnish
Immigrants from Fiji
11th Grade
11th Grade Comparison
Finns
Immigrants from Fiji
94.7%
11TH GRADE
100.0/ 100
METRIC RATING
10th/ 347
METRIC RANK
89.9%
11TH GRADE
0.0/ 100
METRIC RATING
298th/ 347
METRIC RANK
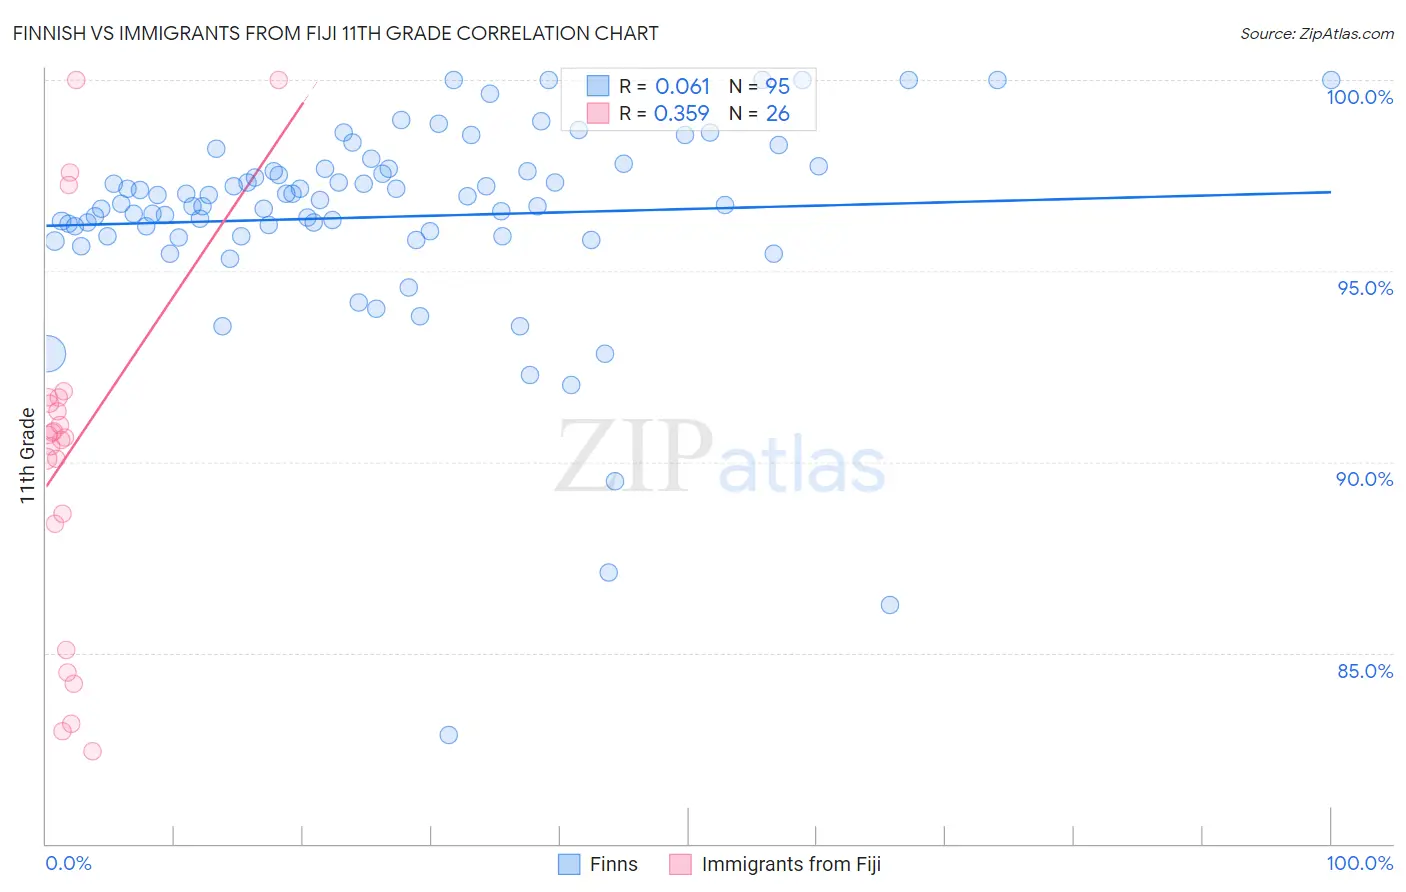
Finnish vs Immigrants from Fiji 11th Grade Correlation Chart
The statistical analysis conducted on geographies consisting of 404,676,167 people shows a slight positive correlation between the proportion of Finns and percentage of population with at least 11th grade education in the United States with a correlation coefficient (R) of 0.061 and weighted average of 94.7%. Similarly, the statistical analysis conducted on geographies consisting of 93,756,204 people shows a mild positive correlation between the proportion of Immigrants from Fiji and percentage of population with at least 11th grade education in the United States with a correlation coefficient (R) of 0.359 and weighted average of 89.9%, a difference of 5.3%.
11th Grade Correlation Summary
| Measurement | Finnish | Immigrants from Fiji |
| Minimum | 82.9% | 82.4% |
| Maximum | 100.0% | 100.0% |
| Range | 17.1% | 17.6% |
| Mean | 96.4% | 90.3% |
| Median | 96.7% | 90.7% |
| Interquartile 25% (IQ1) | 95.9% | 88.4% |
| Interquartile 75% (IQ3) | 97.7% | 91.7% |
| Interquartile Range (IQR) | 1.7% | 3.3% |
| Standard Deviation (Sample) | 2.7% | 4.8% |
| Standard Deviation (Population) | 2.7% | 4.7% |
Similar Demographics by 11th Grade
Demographics Similar to Finns by 11th Grade
In terms of 11th grade, the demographic groups most similar to Finns are German (94.7%, a difference of 0.0%), Latvian (94.7%, a difference of 0.0%), Chinese (94.6%, a difference of 0.040%), Danish (94.7%, a difference of 0.050%), and Polish (94.8%, a difference of 0.090%).
| Demographics | Rating | Rank | 11th Grade |
| Slovenes | 100.0 /100 | #3 | Exceptional 94.9% |
| Slovaks | 100.0 /100 | #4 | Exceptional 94.9% |
| Carpatho Rusyns | 100.0 /100 | #5 | Exceptional 94.8% |
| Lithuanians | 100.0 /100 | #6 | Exceptional 94.8% |
| Poles | 100.0 /100 | #7 | Exceptional 94.8% |
| Croatians | 100.0 /100 | #8 | Exceptional 94.7% |
| Danes | 100.0 /100 | #9 | Exceptional 94.7% |
| Finns | 100.0 /100 | #10 | Exceptional 94.7% |
| Germans | 100.0 /100 | #11 | Exceptional 94.7% |
| Latvians | 100.0 /100 | #12 | Exceptional 94.7% |
| Chinese | 100.0 /100 | #13 | Exceptional 94.6% |
| Eastern Europeans | 100.0 /100 | #14 | Exceptional 94.6% |
| Bulgarians | 100.0 /100 | #15 | Exceptional 94.5% |
| Immigrants | India | 100.0 /100 | #16 | Exceptional 94.5% |
| Luxembourgers | 100.0 /100 | #17 | Exceptional 94.5% |
Demographics Similar to Immigrants from Fiji by 11th Grade
In terms of 11th grade, the demographic groups most similar to Immigrants from Fiji are Japanese (89.9%, a difference of 0.030%), Immigrants from Haiti (89.9%, a difference of 0.040%), Guyanese (89.9%, a difference of 0.050%), Navajo (90.0%, a difference of 0.070%), and Fijian (90.0%, a difference of 0.11%).
| Demographics | Rating | Rank | 11th Grade |
| Haitians | 0.0 /100 | #291 | Tragic 90.3% |
| Cubans | 0.0 /100 | #292 | Tragic 90.2% |
| Natives/Alaskans | 0.0 /100 | #293 | Tragic 90.2% |
| Immigrants | Grenada | 0.0 /100 | #294 | Tragic 90.1% |
| Immigrants | Vietnam | 0.0 /100 | #295 | Tragic 90.0% |
| Fijians | 0.0 /100 | #296 | Tragic 90.0% |
| Navajo | 0.0 /100 | #297 | Tragic 90.0% |
| Immigrants | Fiji | 0.0 /100 | #298 | Tragic 89.9% |
| Japanese | 0.0 /100 | #299 | Tragic 89.9% |
| Immigrants | Haiti | 0.0 /100 | #300 | Tragic 89.9% |
| Guyanese | 0.0 /100 | #301 | Tragic 89.9% |
| Immigrants | Guyana | 0.0 /100 | #302 | Tragic 89.7% |
| Immigrants | Immigrants | 0.0 /100 | #303 | Tragic 89.7% |
| Yuman | 0.0 /100 | #304 | Tragic 89.7% |
| Immigrants | Cambodia | 0.0 /100 | #305 | Tragic 89.6% |