Finnish vs Immigrants from Fiji High School Diploma
COMPARE
Finnish
Immigrants from Fiji
High School Diploma
High School Diploma Comparison
Finns
Immigrants from Fiji
91.7%
HIGH SCHOOL DIPLOMA
100.0/ 100
METRIC RATING
16th/ 347
METRIC RANK
85.8%
HIGH SCHOOL DIPLOMA
0.0/ 100
METRIC RATING
294th/ 347
METRIC RANK
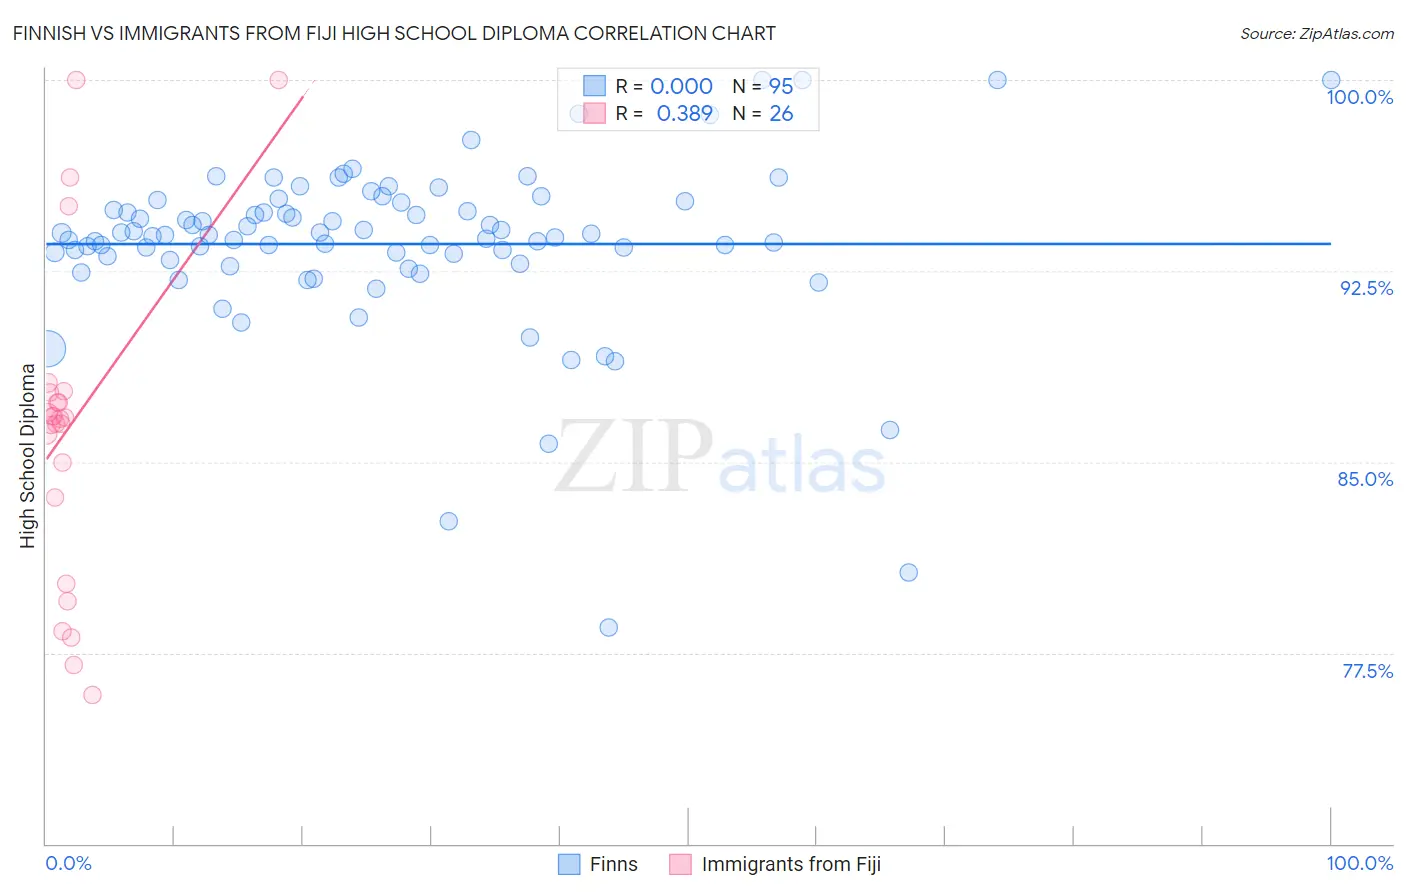
Finnish vs Immigrants from Fiji High School Diploma Correlation Chart
The statistical analysis conducted on geographies consisting of 404,676,167 people shows no correlation between the proportion of Finns and percentage of population with at least high school diploma education in the United States with a correlation coefficient (R) of 0.000 and weighted average of 91.7%. Similarly, the statistical analysis conducted on geographies consisting of 93,756,204 people shows a mild positive correlation between the proportion of Immigrants from Fiji and percentage of population with at least high school diploma education in the United States with a correlation coefficient (R) of 0.389 and weighted average of 85.8%, a difference of 6.9%.
High School Diploma Correlation Summary
| Measurement | Finnish | Immigrants from Fiji |
| Minimum | 78.5% | 75.8% |
| Maximum | 100.0% | 100.0% |
| Range | 21.5% | 24.2% |
| Mean | 93.6% | 86.4% |
| Median | 93.9% | 86.7% |
| Interquartile 25% (IQ1) | 92.9% | 83.6% |
| Interquartile 75% (IQ3) | 95.2% | 87.7% |
| Interquartile Range (IQR) | 2.3% | 4.1% |
| Standard Deviation (Sample) | 3.4% | 6.3% |
| Standard Deviation (Population) | 3.4% | 6.1% |
Similar Demographics by High School Diploma
Demographics Similar to Finns by High School Diploma
In terms of high school diploma, the demographic groups most similar to Finns are Luxembourger (91.7%, a difference of 0.020%), Immigrants from Singapore (91.7%, a difference of 0.040%), Bulgarian (91.8%, a difference of 0.050%), German (91.7%, a difference of 0.050%), and Danish (91.8%, a difference of 0.10%).
| Demographics | Rating | Rank | High School Diploma |
| Latvians | 100.0 /100 | #9 | Exceptional 92.0% |
| Croatians | 100.0 /100 | #10 | Exceptional 92.0% |
| Eastern Europeans | 100.0 /100 | #11 | Exceptional 91.9% |
| Poles | 100.0 /100 | #12 | Exceptional 91.9% |
| Danes | 100.0 /100 | #13 | Exceptional 91.8% |
| Bulgarians | 100.0 /100 | #14 | Exceptional 91.8% |
| Luxembourgers | 100.0 /100 | #15 | Exceptional 91.7% |
| Finns | 100.0 /100 | #16 | Exceptional 91.7% |
| Immigrants | Singapore | 99.9 /100 | #17 | Exceptional 91.7% |
| Germans | 99.9 /100 | #18 | Exceptional 91.7% |
| Maltese | 99.9 /100 | #19 | Exceptional 91.6% |
| Czechs | 99.9 /100 | #20 | Exceptional 91.6% |
| Filipinos | 99.9 /100 | #21 | Exceptional 91.6% |
| Estonians | 99.9 /100 | #22 | Exceptional 91.6% |
| Scandinavians | 99.9 /100 | #23 | Exceptional 91.5% |
Demographics Similar to Immigrants from Fiji by High School Diploma
In terms of high school diploma, the demographic groups most similar to Immigrants from Fiji are Immigrants (85.8%, a difference of 0.020%), British West Indian (85.9%, a difference of 0.040%), Haitian (85.9%, a difference of 0.060%), Japanese (85.9%, a difference of 0.060%), and Fijian (86.0%, a difference of 0.19%).
| Demographics | Rating | Rank | High School Diploma |
| Ute | 0.0 /100 | #287 | Tragic 86.2% |
| Immigrants | Vietnam | 0.0 /100 | #288 | Tragic 86.2% |
| Yup'ik | 0.0 /100 | #289 | Tragic 86.1% |
| Fijians | 0.0 /100 | #290 | Tragic 86.0% |
| Haitians | 0.0 /100 | #291 | Tragic 85.9% |
| Japanese | 0.0 /100 | #292 | Tragic 85.9% |
| British West Indians | 0.0 /100 | #293 | Tragic 85.9% |
| Immigrants | Fiji | 0.0 /100 | #294 | Tragic 85.8% |
| Immigrants | Immigrants | 0.0 /100 | #295 | Tragic 85.8% |
| Immigrants | Cambodia | 0.0 /100 | #296 | Tragic 85.6% |
| Immigrants | Grenada | 0.0 /100 | #297 | Tragic 85.6% |
| Natives/Alaskans | 0.0 /100 | #298 | Tragic 85.6% |
| Guyanese | 0.0 /100 | #299 | Tragic 85.5% |
| Immigrants | Bangladesh | 0.0 /100 | #300 | Tragic 85.5% |
| Vietnamese | 0.0 /100 | #301 | Tragic 85.4% |