Navajo vs Immigrants from Fiji 4th Grade
COMPARE
Navajo
Immigrants from Fiji
4th Grade
4th Grade Comparison
Navajo
Immigrants from Fiji
97.4%
4TH GRADE
30.7/ 100
METRIC RATING
191st/ 347
METRIC RANK
95.8%
4TH GRADE
0.0/ 100
METRIC RATING
330th/ 347
METRIC RANK
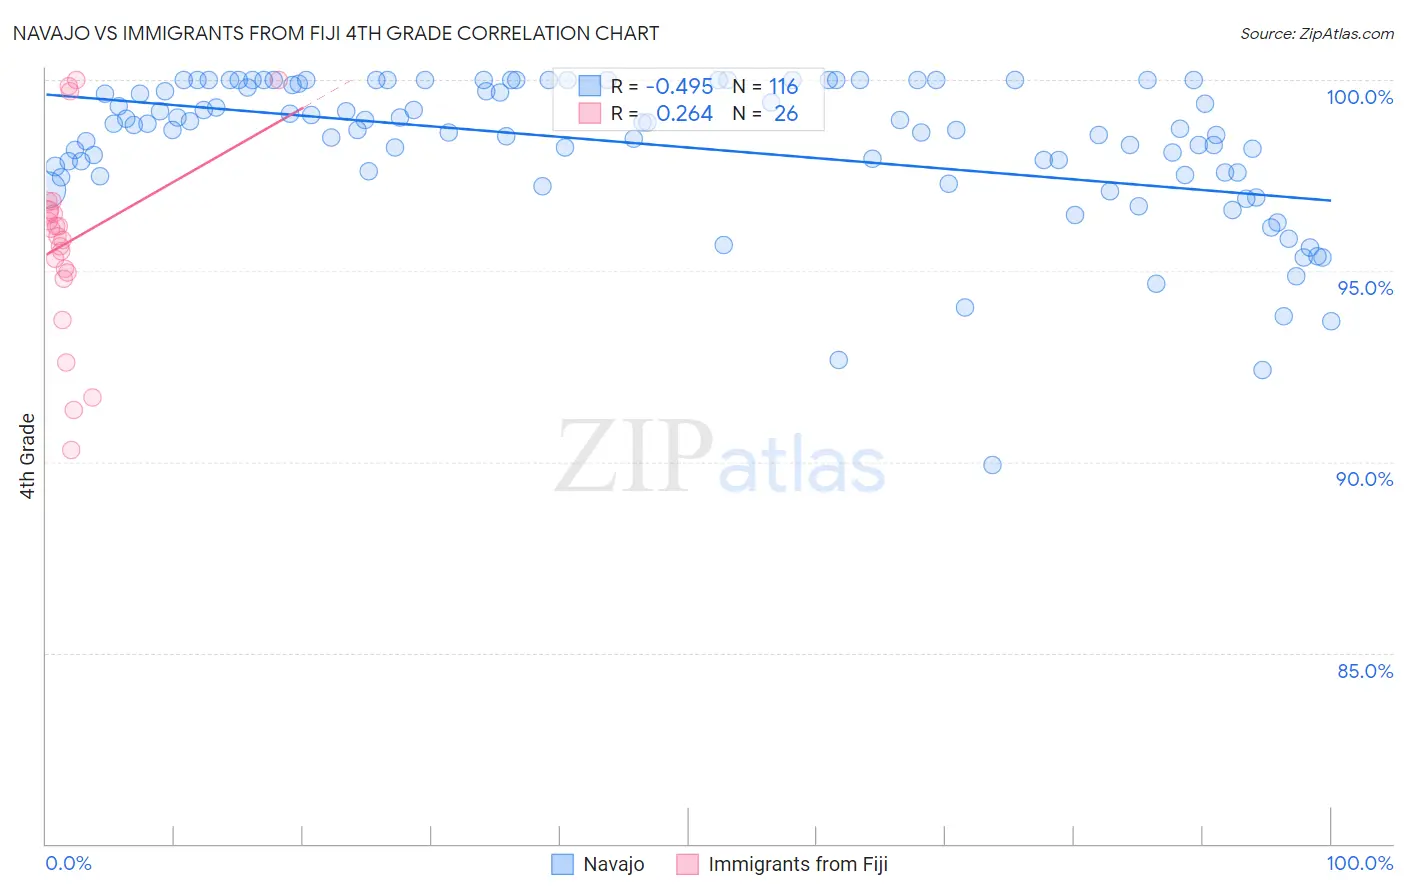
Navajo vs Immigrants from Fiji 4th Grade Correlation Chart
The statistical analysis conducted on geographies consisting of 224,872,987 people shows a moderate negative correlation between the proportion of Navajo and percentage of population with at least 4th grade education in the United States with a correlation coefficient (R) of -0.495 and weighted average of 97.4%. Similarly, the statistical analysis conducted on geographies consisting of 93,756,204 people shows a weak positive correlation between the proportion of Immigrants from Fiji and percentage of population with at least 4th grade education in the United States with a correlation coefficient (R) of 0.264 and weighted average of 95.8%, a difference of 1.7%.
4th Grade Correlation Summary
| Measurement | Navajo | Immigrants from Fiji |
| Minimum | 89.9% | 90.3% |
| Maximum | 100.0% | 100.0% |
| Range | 10.1% | 9.7% |
| Mean | 98.3% | 95.8% |
| Median | 98.8% | 96.0% |
| Interquartile 25% (IQ1) | 97.6% | 94.9% |
| Interquartile 75% (IQ3) | 99.9% | 96.6% |
| Interquartile Range (IQR) | 2.4% | 1.7% |
| Standard Deviation (Sample) | 1.9% | 2.5% |
| Standard Deviation (Population) | 1.9% | 2.4% |
Similar Demographics by 4th Grade
Demographics Similar to Navajo by 4th Grade
In terms of 4th grade, the demographic groups most similar to Navajo are Black/African American (97.4%, a difference of 0.0%), Immigrants from Ukraine (97.4%, a difference of 0.0%), Immigrants from Egypt (97.4%, a difference of 0.0%), Panamanian (97.4%, a difference of 0.010%), and Portuguese (97.4%, a difference of 0.010%).
| Demographics | Rating | Rank | 4th Grade |
| Pakistanis | 36.2 /100 | #184 | Fair 97.5% |
| Immigrants | Kenya | 35.8 /100 | #185 | Fair 97.5% |
| Dutch West Indians | 35.8 /100 | #186 | Fair 97.5% |
| Mongolians | 34.7 /100 | #187 | Fair 97.5% |
| Immigrants | Argentina | 34.6 /100 | #188 | Fair 97.5% |
| Panamanians | 31.9 /100 | #189 | Fair 97.4% |
| Blacks/African Americans | 31.1 /100 | #190 | Fair 97.4% |
| Navajo | 30.7 /100 | #191 | Fair 97.4% |
| Immigrants | Ukraine | 30.1 /100 | #192 | Fair 97.4% |
| Immigrants | Egypt | 30.1 /100 | #193 | Fair 97.4% |
| Portuguese | 29.2 /100 | #194 | Fair 97.4% |
| Paraguayans | 28.9 /100 | #195 | Fair 97.4% |
| Immigrants | Albania | 27.7 /100 | #196 | Fair 97.4% |
| Hawaiians | 25.6 /100 | #197 | Fair 97.4% |
| Guamanians/Chamorros | 23.0 /100 | #198 | Fair 97.4% |
Demographics Similar to Immigrants from Fiji by 4th Grade
In terms of 4th grade, the demographic groups most similar to Immigrants from Fiji are Immigrants from Cambodia (95.8%, a difference of 0.0%), Mexican American Indian (95.8%, a difference of 0.020%), Immigrants from Armenia (95.8%, a difference of 0.050%), Immigrants from Honduras (95.8%, a difference of 0.060%), and Immigrants from Dominican Republic (95.7%, a difference of 0.11%).
| Demographics | Rating | Rank | 4th Grade |
| Immigrants | Nicaragua | 0.0 /100 | #323 | Tragic 96.0% |
| Immigrants | Belize | 0.0 /100 | #324 | Tragic 96.0% |
| Dominicans | 0.0 /100 | #325 | Tragic 96.0% |
| Hispanics or Latinos | 0.0 /100 | #326 | Tragic 96.0% |
| Hondurans | 0.0 /100 | #327 | Tragic 96.0% |
| Mexican American Indians | 0.0 /100 | #328 | Tragic 95.8% |
| Immigrants | Cambodia | 0.0 /100 | #329 | Tragic 95.8% |
| Immigrants | Fiji | 0.0 /100 | #330 | Tragic 95.8% |
| Immigrants | Armenia | 0.0 /100 | #331 | Tragic 95.8% |
| Immigrants | Honduras | 0.0 /100 | #332 | Tragic 95.8% |
| Immigrants | Dominican Republic | 0.0 /100 | #333 | Tragic 95.7% |
| Immigrants | Cabo Verde | 0.0 /100 | #334 | Tragic 95.7% |
| Immigrants | Latin America | 0.0 /100 | #335 | Tragic 95.7% |
| Mexicans | 0.0 /100 | #336 | Tragic 95.6% |
| Central Americans | 0.0 /100 | #337 | Tragic 95.5% |