Finnish vs Cuban 4th Grade
COMPARE
Finnish
Cuban
4th Grade
4th Grade Comparison
Finns
Cubans
98.3%
4TH GRADE
100.0/ 100
METRIC RATING
22nd/ 347
METRIC RANK
96.9%
4TH GRADE
0.2/ 100
METRIC RATING
270th/ 347
METRIC RANK
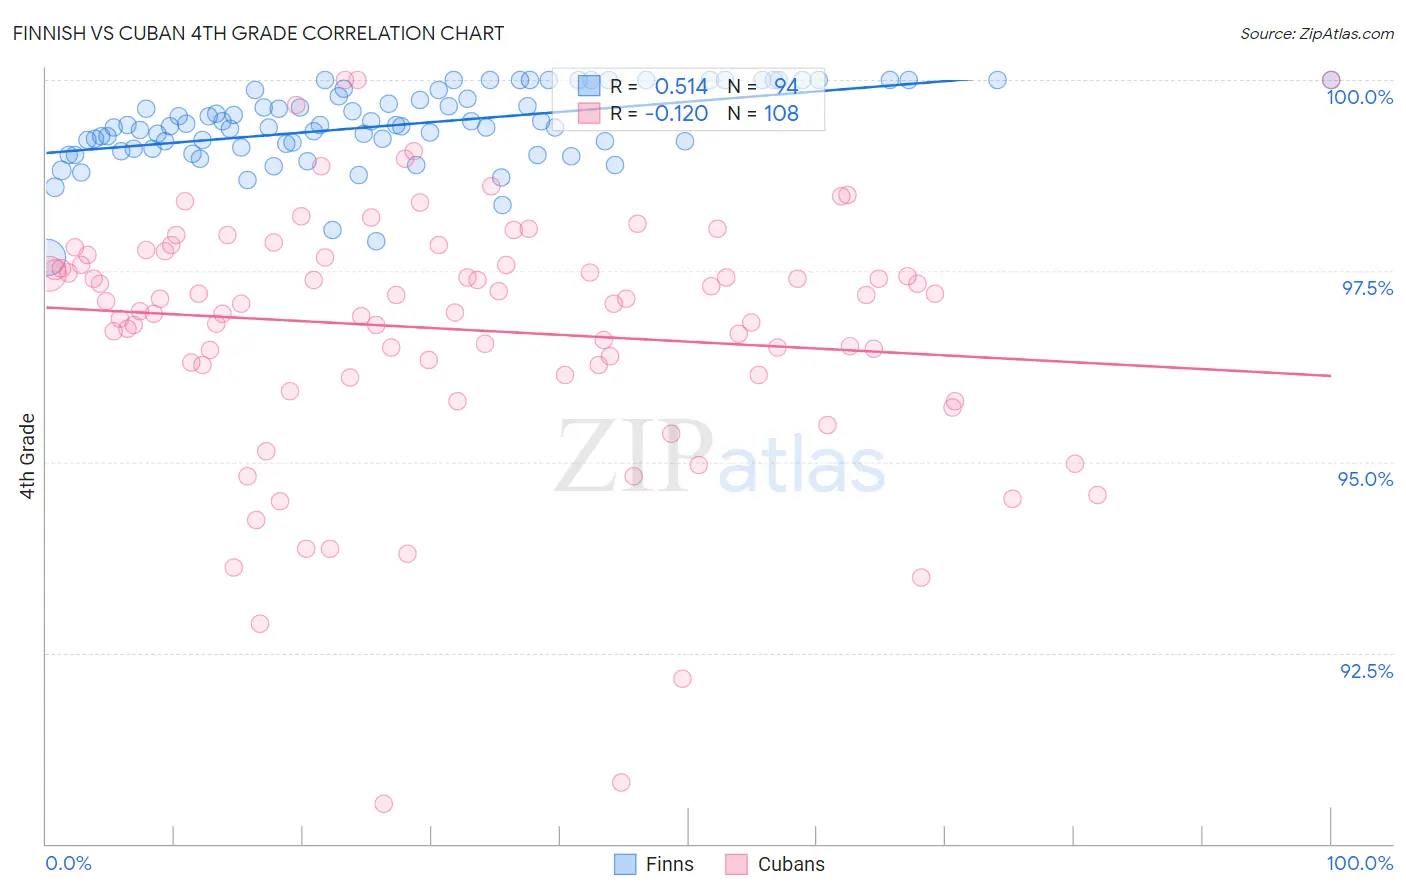
Finnish vs Cuban 4th Grade Correlation Chart
The statistical analysis conducted on geographies consisting of 404,675,516 people shows a substantial positive correlation between the proportion of Finns and percentage of population with at least 4th grade education in the United States with a correlation coefficient (R) of 0.514 and weighted average of 98.3%. Similarly, the statistical analysis conducted on geographies consisting of 449,326,865 people shows a poor negative correlation between the proportion of Cubans and percentage of population with at least 4th grade education in the United States with a correlation coefficient (R) of -0.120 and weighted average of 96.9%, a difference of 1.5%.
4th Grade Correlation Summary
| Measurement | Finnish | Cuban |
| Minimum | 97.7% | 90.5% |
| Maximum | 100.0% | 100.0% |
| Range | 2.3% | 9.5% |
| Mean | 99.4% | 96.7% |
| Median | 99.4% | 97.1% |
| Interquartile 25% (IQ1) | 99.1% | 96.2% |
| Interquartile 75% (IQ3) | 99.9% | 97.7% |
| Interquartile Range (IQR) | 0.75% | 1.5% |
| Standard Deviation (Sample) | 0.50% | 1.7% |
| Standard Deviation (Population) | 0.49% | 1.7% |
Similar Demographics by 4th Grade
Demographics Similar to Finns by 4th Grade
In terms of 4th grade, the demographic groups most similar to Finns are Lithuanian (98.3%, a difference of 0.0%), Alaska Native (98.4%, a difference of 0.010%), Sioux (98.3%, a difference of 0.010%), Polish (98.4%, a difference of 0.020%), and Irish (98.4%, a difference of 0.020%).
| Demographics | Rating | Rank | 4th Grade |
| Dutch | 100.0 /100 | #15 | Exceptional 98.4% |
| Scottish | 100.0 /100 | #16 | Exceptional 98.4% |
| Pennsylvania Germans | 100.0 /100 | #17 | Exceptional 98.4% |
| Poles | 100.0 /100 | #18 | Exceptional 98.4% |
| Irish | 100.0 /100 | #19 | Exceptional 98.4% |
| Alaska Natives | 100.0 /100 | #20 | Exceptional 98.4% |
| Lithuanians | 100.0 /100 | #21 | Exceptional 98.3% |
| Finns | 100.0 /100 | #22 | Exceptional 98.3% |
| Sioux | 100.0 /100 | #23 | Exceptional 98.3% |
| Danes | 100.0 /100 | #24 | Exceptional 98.3% |
| Scotch-Irish | 100.0 /100 | #25 | Exceptional 98.3% |
| Croatians | 100.0 /100 | #26 | Exceptional 98.3% |
| French Canadians | 100.0 /100 | #27 | Exceptional 98.3% |
| French | 100.0 /100 | #28 | Exceptional 98.3% |
| Czechs | 100.0 /100 | #29 | Exceptional 98.3% |
Demographics Similar to Cubans by 4th Grade
In terms of 4th grade, the demographic groups most similar to Cubans are Immigrants from Peru (96.9%, a difference of 0.010%), Fijian (96.9%, a difference of 0.010%), Immigrants from Uzbekistan (96.9%, a difference of 0.020%), Immigrants from Cameroon (96.9%, a difference of 0.020%), and Trinidadian and Tobagonian (96.9%, a difference of 0.030%).
| Demographics | Rating | Rank | 4th Grade |
| Immigrants | Jamaica | 0.3 /100 | #263 | Tragic 97.0% |
| Taiwanese | 0.3 /100 | #264 | Tragic 97.0% |
| Armenians | 0.3 /100 | #265 | Tragic 97.0% |
| Immigrants | China | 0.3 /100 | #266 | Tragic 97.0% |
| Immigrants | Nigeria | 0.3 /100 | #267 | Tragic 97.0% |
| Ghanaians | 0.2 /100 | #268 | Tragic 97.0% |
| Immigrants | Uzbekistan | 0.2 /100 | #269 | Tragic 96.9% |
| Cubans | 0.2 /100 | #270 | Tragic 96.9% |
| Immigrants | Peru | 0.1 /100 | #271 | Tragic 96.9% |
| Fijians | 0.1 /100 | #272 | Tragic 96.9% |
| Immigrants | Cameroon | 0.1 /100 | #273 | Tragic 96.9% |
| Trinidadians and Tobagonians | 0.1 /100 | #274 | Tragic 96.9% |
| Immigrants | Ghana | 0.1 /100 | #275 | Tragic 96.9% |
| Yaqui | 0.1 /100 | #276 | Tragic 96.9% |
| Immigrants | Western Africa | 0.1 /100 | #277 | Tragic 96.9% |