Finnish vs Ecuadorian Median Female Earnings
COMPARE
Finnish
Ecuadorian
Median Female Earnings
Median Female Earnings Comparison
Finns
Ecuadorians
$38,173
MEDIAN FEMALE EARNINGS
4.0/ 100
METRIC RATING
240th/ 347
METRIC RANK
$39,117
MEDIAN FEMALE EARNINGS
23.0/ 100
METRIC RATING
198th/ 347
METRIC RANK
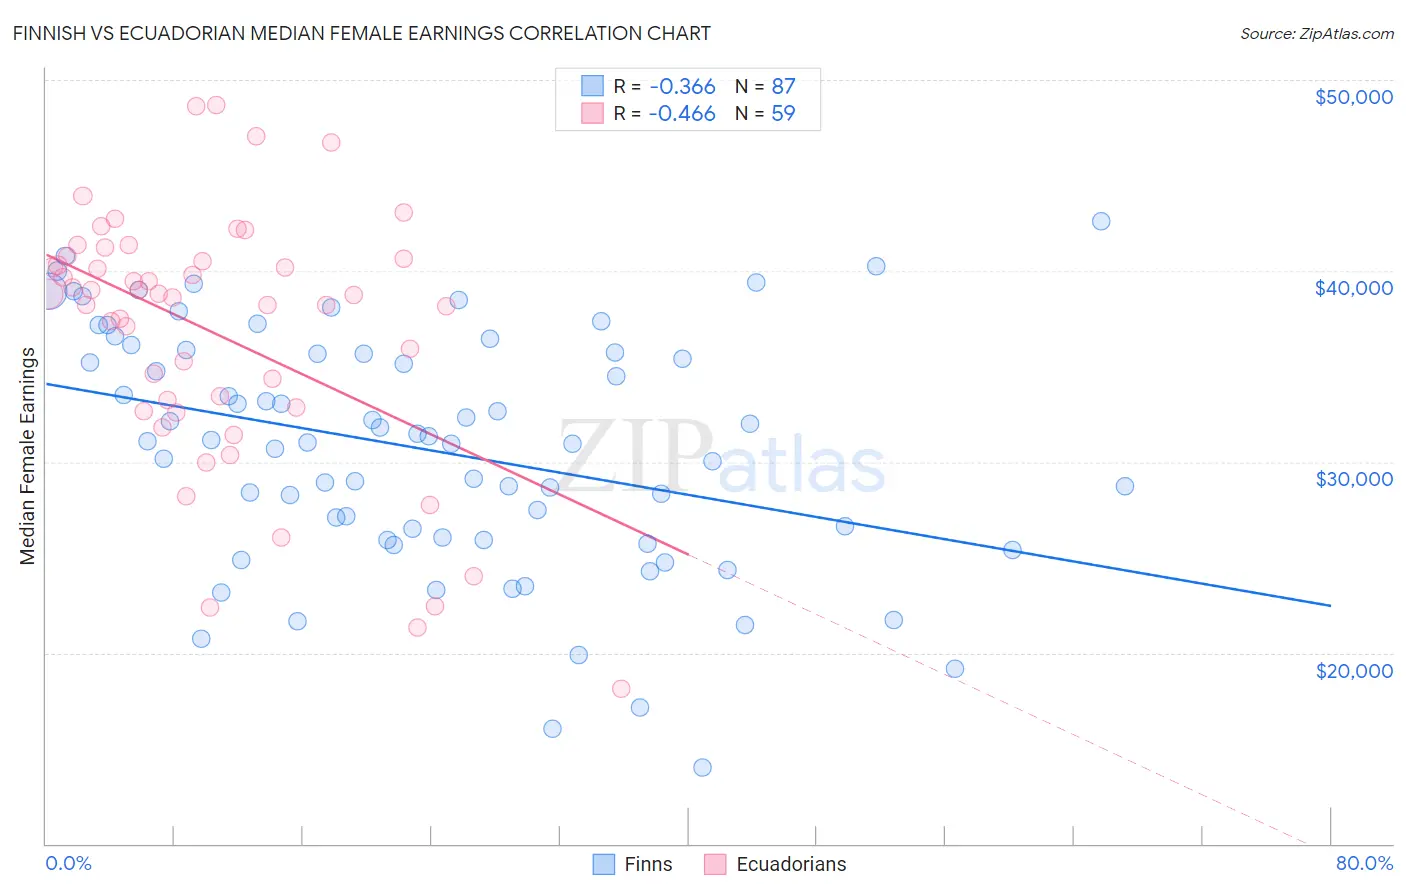
Finnish vs Ecuadorian Median Female Earnings Correlation Chart
The statistical analysis conducted on geographies consisting of 404,382,146 people shows a mild negative correlation between the proportion of Finns and median female earnings in the United States with a correlation coefficient (R) of -0.366 and weighted average of $38,173. Similarly, the statistical analysis conducted on geographies consisting of 317,768,911 people shows a moderate negative correlation between the proportion of Ecuadorians and median female earnings in the United States with a correlation coefficient (R) of -0.466 and weighted average of $39,117, a difference of 2.5%.
Median Female Earnings Correlation Summary
| Measurement | Finnish | Ecuadorian |
| Minimum | $14,000 | $18,150 |
| Maximum | $42,614 | $48,689 |
| Range | $28,614 | $30,539 |
| Mean | $30,656 | $36,751 |
| Median | $31,094 | $38,737 |
| Interquartile 25% (IQ1) | $25,915 | $32,822 |
| Interquartile 75% (IQ3) | $35,736 | $40,668 |
| Interquartile Range (IQR) | $9,822 | $7,846 |
| Standard Deviation (Sample) | $6,298 | $6,680 |
| Standard Deviation (Population) | $6,261 | $6,623 |
Similar Demographics by Median Female Earnings
Demographics Similar to Finns by Median Female Earnings
In terms of median female earnings, the demographic groups most similar to Finns are English ($38,196, a difference of 0.060%), Alaska Native ($38,202, a difference of 0.080%), Immigrants from Cabo Verde ($38,208, a difference of 0.090%), Sudanese ($38,215, a difference of 0.11%), and Liberian ($38,215, a difference of 0.11%).
| Demographics | Rating | Rank | Median Female Earnings |
| Tongans | 5.1 /100 | #233 | Tragic $38,288 |
| Celtics | 5.0 /100 | #234 | Tragic $38,283 |
| Sudanese | 4.4 /100 | #235 | Tragic $38,215 |
| Liberians | 4.4 /100 | #236 | Tragic $38,215 |
| Immigrants | Cabo Verde | 4.3 /100 | #237 | Tragic $38,208 |
| Alaska Natives | 4.3 /100 | #238 | Tragic $38,202 |
| English | 4.2 /100 | #239 | Tragic $38,196 |
| Finns | 4.0 /100 | #240 | Tragic $38,173 |
| Spanish | 3.5 /100 | #241 | Tragic $38,098 |
| Immigrants | Burma/Myanmar | 3.0 /100 | #242 | Tragic $38,028 |
| Germans | 2.8 /100 | #243 | Tragic $37,986 |
| Immigrants | Liberia | 2.7 /100 | #244 | Tragic $37,970 |
| Immigrants | Middle Africa | 2.7 /100 | #245 | Tragic $37,965 |
| Delaware | 2.6 /100 | #246 | Tragic $37,964 |
| Immigrants | Somalia | 2.4 /100 | #247 | Tragic $37,914 |
Demographics Similar to Ecuadorians by Median Female Earnings
In terms of median female earnings, the demographic groups most similar to Ecuadorians are Icelander ($39,109, a difference of 0.020%), Assyrian/Chaldean/Syriac ($39,159, a difference of 0.11%), Immigrants from Panama ($39,049, a difference of 0.17%), Panamanian ($39,049, a difference of 0.17%), and Immigrants from Costa Rica ($39,186, a difference of 0.18%).
| Demographics | Rating | Rank | Median Female Earnings |
| Immigrants | Western Africa | 32.7 /100 | #191 | Fair $39,351 |
| Immigrants | Immigrants | 31.7 /100 | #192 | Fair $39,328 |
| Immigrants | Nigeria | 30.2 /100 | #193 | Fair $39,294 |
| Irish | 30.0 /100 | #194 | Fair $39,291 |
| Uruguayans | 27.3 /100 | #195 | Fair $39,228 |
| Immigrants | Costa Rica | 25.6 /100 | #196 | Fair $39,186 |
| Assyrians/Chaldeans/Syriacs | 24.6 /100 | #197 | Fair $39,159 |
| Ecuadorians | 23.0 /100 | #198 | Fair $39,117 |
| Icelanders | 22.7 /100 | #199 | Fair $39,109 |
| Immigrants | Panama | 20.6 /100 | #200 | Fair $39,049 |
| Panamanians | 20.6 /100 | #201 | Fair $39,049 |
| Slovaks | 19.9 /100 | #202 | Poor $39,029 |
| Czechs | 18.7 /100 | #203 | Poor $38,992 |
| Immigrants | Uruguay | 17.3 /100 | #204 | Poor $38,945 |
| Immigrants | Colombia | 16.3 /100 | #205 | Poor $38,913 |