Finnish vs Celtic Unemployment Among Ages 16 to 19 years
COMPARE
Finnish
Celtic
Unemployment Among Ages 16 to 19 years
Unemployment Among Ages 16 to 19 years Comparison
Finns
Celtics
15.9%
UNEMPLOYMENT AMONG AGES 16 TO 19 YEARS
100.0/ 100
METRIC RATING
22nd/ 347
METRIC RANK
17.6%
UNEMPLOYMENT AMONG AGES 16 TO 19 YEARS
48.7/ 100
METRIC RATING
178th/ 347
METRIC RANK
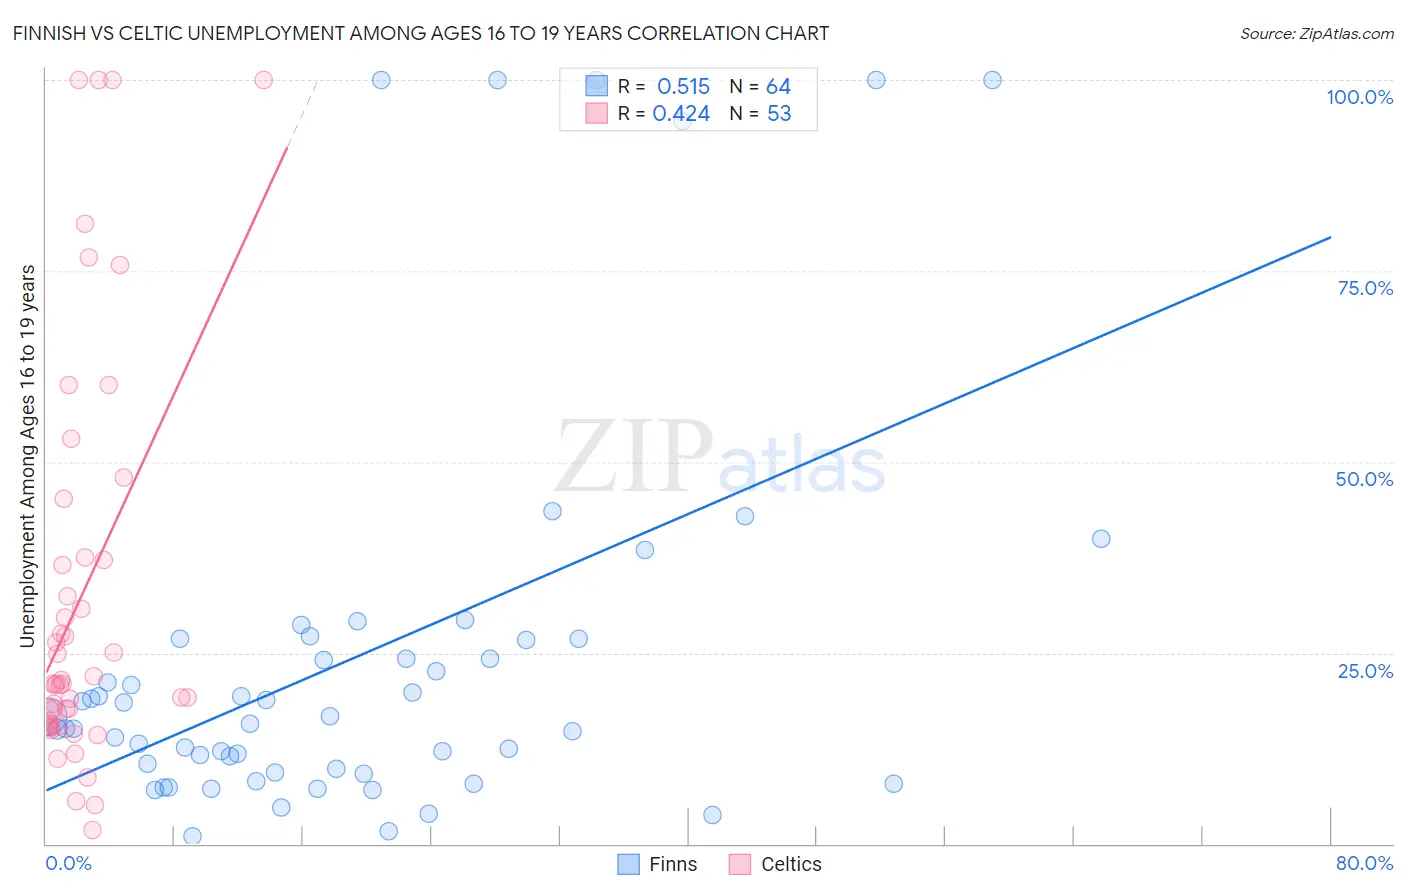
Finnish vs Celtic Unemployment Among Ages 16 to 19 years Correlation Chart
The statistical analysis conducted on geographies consisting of 379,037,944 people shows a substantial positive correlation between the proportion of Finns and unemployment rate among population between the ages 16 and 19 in the United States with a correlation coefficient (R) of 0.515 and weighted average of 15.9%. Similarly, the statistical analysis conducted on geographies consisting of 163,923,986 people shows a moderate positive correlation between the proportion of Celtics and unemployment rate among population between the ages 16 and 19 in the United States with a correlation coefficient (R) of 0.424 and weighted average of 17.6%, a difference of 10.7%.
Unemployment Among Ages 16 to 19 years Correlation Summary
| Measurement | Finnish | Celtic |
| Minimum | 1.0% | 1.8% |
| Maximum | 100.0% | 100.0% |
| Range | 99.0% | 98.2% |
| Mean | 24.5% | 32.2% |
| Median | 16.2% | 21.0% |
| Interquartile 25% (IQ1) | 9.6% | 15.6% |
| Interquartile 75% (IQ3) | 26.7% | 37.3% |
| Interquartile Range (IQR) | 17.1% | 21.7% |
| Standard Deviation (Sample) | 26.0% | 26.4% |
| Standard Deviation (Population) | 25.8% | 26.1% |
Similar Demographics by Unemployment Among Ages 16 to 19 years
Demographics Similar to Finns by Unemployment Among Ages 16 to 19 years
In terms of unemployment among ages 16 to 19 years, the demographic groups most similar to Finns are Belgian (15.9%, a difference of 0.040%), Tongan (15.9%, a difference of 0.19%), Filipino (15.9%, a difference of 0.29%), Immigrants from Taiwan (15.8%, a difference of 0.36%), and Dutch (15.9%, a difference of 0.36%).
| Demographics | Rating | Rank | Unemployment Among Ages 16 to 19 years |
| Yugoslavians | 100.0 /100 | #15 | Exceptional 15.6% |
| Germans | 100.0 /100 | #16 | Exceptional 15.7% |
| Somalis | 100.0 /100 | #17 | Exceptional 15.7% |
| Thais | 100.0 /100 | #18 | Exceptional 15.7% |
| Swiss | 100.0 /100 | #19 | Exceptional 15.8% |
| Sudanese | 100.0 /100 | #20 | Exceptional 15.8% |
| Immigrants | Taiwan | 100.0 /100 | #21 | Exceptional 15.8% |
| Finns | 100.0 /100 | #22 | Exceptional 15.9% |
| Belgians | 100.0 /100 | #23 | Exceptional 15.9% |
| Tongans | 100.0 /100 | #24 | Exceptional 15.9% |
| Filipinos | 100.0 /100 | #25 | Exceptional 15.9% |
| Dutch | 100.0 /100 | #26 | Exceptional 15.9% |
| Immigrants | Sudan | 99.9 /100 | #27 | Exceptional 16.0% |
| Jordanians | 99.9 /100 | #28 | Exceptional 16.0% |
| Chinese | 99.9 /100 | #29 | Exceptional 16.0% |
Demographics Similar to Celtics by Unemployment Among Ages 16 to 19 years
In terms of unemployment among ages 16 to 19 years, the demographic groups most similar to Celtics are Bermudan (17.6%, a difference of 0.0%), Nicaraguan (17.6%, a difference of 0.010%), Immigrants from Sweden (17.6%, a difference of 0.020%), Osage (17.6%, a difference of 0.060%), and American (17.6%, a difference of 0.060%).
| Demographics | Rating | Rank | Unemployment Among Ages 16 to 19 years |
| Immigrants | Switzerland | 53.2 /100 | #171 | Average 17.5% |
| Immigrants | Western Europe | 52.2 /100 | #172 | Average 17.6% |
| Chileans | 50.8 /100 | #173 | Average 17.6% |
| Osage | 50.0 /100 | #174 | Average 17.6% |
| Immigrants | Sweden | 49.1 /100 | #175 | Average 17.6% |
| Nicaraguans | 48.9 /100 | #176 | Average 17.6% |
| Bermudans | 48.7 /100 | #177 | Average 17.6% |
| Celtics | 48.7 /100 | #178 | Average 17.6% |
| Americans | 47.4 /100 | #179 | Average 17.6% |
| Spaniards | 47.1 /100 | #180 | Average 17.6% |
| Immigrants | Turkey | 45.6 /100 | #181 | Average 17.6% |
| Russians | 45.2 /100 | #182 | Average 17.6% |
| Immigrants | Uruguay | 44.6 /100 | #183 | Average 17.6% |
| Eastern Europeans | 44.3 /100 | #184 | Average 17.6% |
| Iroquois | 43.4 /100 | #185 | Average 17.6% |