Immigrants from Africa vs Russian Master's Degree
COMPARE
Immigrants from Africa
Russian
Master's Degree
Master's Degree Comparison
Immigrants from Africa
Russians
15.7%
MASTER'S DEGREE
84.0/ 100
METRIC RATING
142nd/ 347
METRIC RANK
19.5%
MASTER'S DEGREE
100.0/ 100
METRIC RATING
33rd/ 347
METRIC RANK
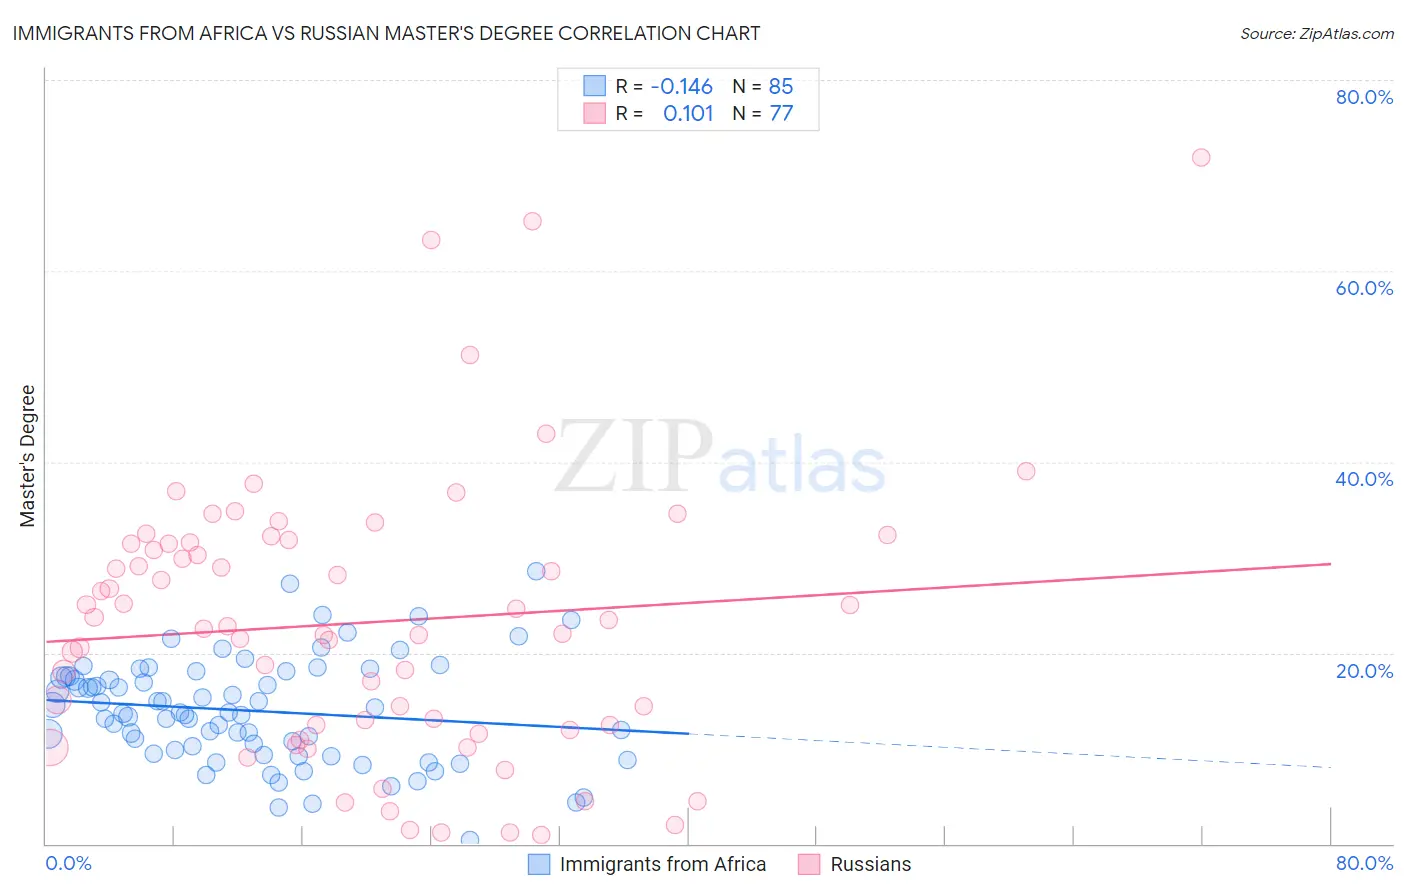
Immigrants from Africa vs Russian Master's Degree Correlation Chart
The statistical analysis conducted on geographies consisting of 469,202,682 people shows a poor negative correlation between the proportion of Immigrants from Africa and percentage of population with at least master's degree education in the United States with a correlation coefficient (R) of -0.146 and weighted average of 15.7%. Similarly, the statistical analysis conducted on geographies consisting of 511,948,246 people shows a poor positive correlation between the proportion of Russians and percentage of population with at least master's degree education in the United States with a correlation coefficient (R) of 0.101 and weighted average of 19.5%, a difference of 24.4%.
Master's Degree Correlation Summary
| Measurement | Immigrants from Africa | Russian |
| Minimum | 0.40% | 0.93% |
| Maximum | 28.6% | 71.9% |
| Range | 28.2% | 70.9% |
| Mean | 13.9% | 23.2% |
| Median | 13.7% | 22.8% |
| Interquartile 25% (IQ1) | 9.7% | 12.2% |
| Interquartile 75% (IQ3) | 17.5% | 31.5% |
| Interquartile Range (IQR) | 7.9% | 19.3% |
| Standard Deviation (Sample) | 5.5% | 14.4% |
| Standard Deviation (Population) | 5.5% | 14.3% |
Similar Demographics by Master's Degree
Demographics Similar to Immigrants from Africa by Master's Degree
In terms of master's degree, the demographic groups most similar to Immigrants from Africa are Immigrants from Venezuela (15.7%, a difference of 0.090%), Canadian (15.7%, a difference of 0.17%), Polish (15.7%, a difference of 0.23%), Vietnamese (15.8%, a difference of 0.36%), and Immigrants from Germany (15.8%, a difference of 0.44%).
| Demographics | Rating | Rank | Master's Degree |
| South American Indians | 88.4 /100 | #135 | Excellent 15.9% |
| Assyrians/Chaldeans/Syriacs | 86.8 /100 | #136 | Excellent 15.8% |
| Europeans | 86.4 /100 | #137 | Excellent 15.8% |
| Pakistanis | 86.1 /100 | #138 | Excellent 15.8% |
| Immigrants | Germany | 85.9 /100 | #139 | Excellent 15.8% |
| Vietnamese | 85.5 /100 | #140 | Excellent 15.8% |
| Poles | 85.0 /100 | #141 | Excellent 15.7% |
| Immigrants | Africa | 84.0 /100 | #142 | Excellent 15.7% |
| Immigrants | Venezuela | 83.6 /100 | #143 | Excellent 15.7% |
| Canadians | 83.3 /100 | #144 | Excellent 15.7% |
| South Americans | 81.3 /100 | #145 | Excellent 15.6% |
| Immigrants | Afghanistan | 79.4 /100 | #146 | Good 15.6% |
| Hungarians | 79.1 /100 | #147 | Good 15.6% |
| Immigrants | Senegal | 78.2 /100 | #148 | Good 15.5% |
| Ghanaians | 78.2 /100 | #149 | Good 15.5% |
Demographics Similar to Russians by Master's Degree
In terms of master's degree, the demographic groups most similar to Russians are Immigrants from Denmark (19.5%, a difference of 0.030%), Immigrants from Northern Europe (19.5%, a difference of 0.36%), Immigrants from Russia (19.4%, a difference of 0.73%), Mongolian (19.4%, a difference of 0.77%), and Burmese (19.7%, a difference of 0.79%).
| Demographics | Rating | Rank | Master's Degree |
| Cambodians | 100.0 /100 | #26 | Exceptional 20.0% |
| Immigrants | Sri Lanka | 100.0 /100 | #27 | Exceptional 19.9% |
| Turks | 100.0 /100 | #28 | Exceptional 19.9% |
| Latvians | 100.0 /100 | #29 | Exceptional 19.8% |
| Immigrants | Turkey | 100.0 /100 | #30 | Exceptional 19.7% |
| Immigrants | Korea | 100.0 /100 | #31 | Exceptional 19.7% |
| Burmese | 100.0 /100 | #32 | Exceptional 19.7% |
| Russians | 100.0 /100 | #33 | Exceptional 19.5% |
| Immigrants | Denmark | 100.0 /100 | #34 | Exceptional 19.5% |
| Immigrants | Northern Europe | 100.0 /100 | #35 | Exceptional 19.5% |
| Immigrants | Russia | 100.0 /100 | #36 | Exceptional 19.4% |
| Mongolians | 100.0 /100 | #37 | Exceptional 19.4% |
| Bolivians | 100.0 /100 | #38 | Exceptional 19.3% |
| Immigrants | Spain | 100.0 /100 | #39 | Exceptional 19.1% |
| Immigrants | Bolivia | 100.0 /100 | #40 | Exceptional 19.1% |