Fijian vs Immigrants from Cameroon Master's Degree
COMPARE
Fijian
Immigrants from Cameroon
Master's Degree
Master's Degree Comparison
Fijians
Immigrants from Cameroon
10.3%
MASTER'S DEGREE
0.0/ 100
METRIC RATING
330th/ 347
METRIC RANK
15.4%
MASTER'S DEGREE
71.7/ 100
METRIC RATING
157th/ 347
METRIC RANK
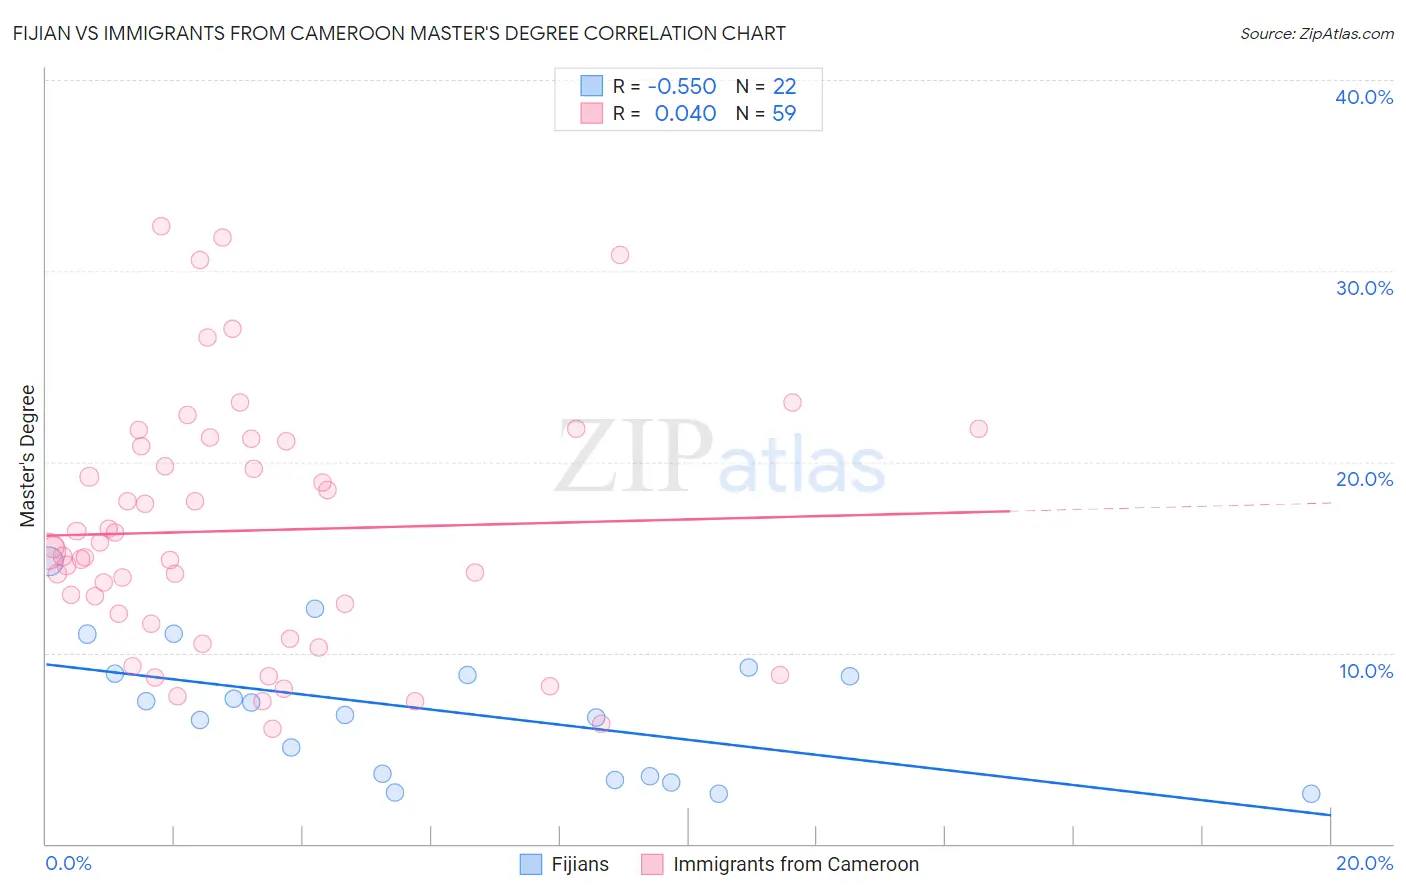
Fijian vs Immigrants from Cameroon Master's Degree Correlation Chart
The statistical analysis conducted on geographies consisting of 55,944,571 people shows a substantial negative correlation between the proportion of Fijians and percentage of population with at least master's degree education in the United States with a correlation coefficient (R) of -0.550 and weighted average of 10.3%. Similarly, the statistical analysis conducted on geographies consisting of 130,754,355 people shows no correlation between the proportion of Immigrants from Cameroon and percentage of population with at least master's degree education in the United States with a correlation coefficient (R) of 0.040 and weighted average of 15.4%, a difference of 49.3%.
Master's Degree Correlation Summary
| Measurement | Fijian | Immigrants from Cameroon |
| Minimum | 2.6% | 6.0% |
| Maximum | 14.8% | 32.3% |
| Range | 12.2% | 26.3% |
| Mean | 7.0% | 16.4% |
| Median | 7.1% | 15.3% |
| Interquartile 25% (IQ1) | 3.5% | 11.5% |
| Interquartile 75% (IQ3) | 8.9% | 21.1% |
| Interquartile Range (IQR) | 5.4% | 9.5% |
| Standard Deviation (Sample) | 3.4% | 6.6% |
| Standard Deviation (Population) | 3.4% | 6.5% |
Similar Demographics by Master's Degree
Demographics Similar to Fijians by Master's Degree
In terms of master's degree, the demographic groups most similar to Fijians are Pueblo (10.3%, a difference of 0.16%), Immigrants from the Azores (10.2%, a difference of 0.63%), Menominee (10.2%, a difference of 1.0%), Nepalese (10.5%, a difference of 1.7%), and Bangladeshi (10.5%, a difference of 1.8%).
| Demographics | Rating | Rank | Master's Degree |
| Crow | 0.0 /100 | #323 | Tragic 10.6% |
| Dutch West Indians | 0.0 /100 | #324 | Tragic 10.6% |
| Inupiat | 0.0 /100 | #325 | Tragic 10.5% |
| Creek | 0.0 /100 | #326 | Tragic 10.5% |
| Paiute | 0.0 /100 | #327 | Tragic 10.5% |
| Bangladeshis | 0.0 /100 | #328 | Tragic 10.5% |
| Nepalese | 0.0 /100 | #329 | Tragic 10.5% |
| Fijians | 0.0 /100 | #330 | Tragic 10.3% |
| Pueblo | 0.0 /100 | #331 | Tragic 10.3% |
| Immigrants | Azores | 0.0 /100 | #332 | Tragic 10.2% |
| Menominee | 0.0 /100 | #333 | Tragic 10.2% |
| Arapaho | 0.0 /100 | #334 | Tragic 10.0% |
| Immigrants | Central America | 0.0 /100 | #335 | Tragic 10.0% |
| Natives/Alaskans | 0.0 /100 | #336 | Tragic 9.9% |
| Mexicans | 0.0 /100 | #337 | Tragic 9.7% |
Demographics Similar to Immigrants from Cameroon by Master's Degree
In terms of master's degree, the demographic groups most similar to Immigrants from Cameroon are Immigrants from Poland (15.4%, a difference of 0.040%), Luxembourger (15.3%, a difference of 0.11%), Kenyan (15.3%, a difference of 0.22%), Bermudan (15.4%, a difference of 0.35%), and Sudanese (15.3%, a difference of 0.45%).
| Demographics | Rating | Rank | Master's Degree |
| Slovenes | 78.0 /100 | #150 | Good 15.5% |
| Iraqis | 77.3 /100 | #151 | Good 15.5% |
| Slavs | 77.0 /100 | #152 | Good 15.5% |
| Icelanders | 76.8 /100 | #153 | Good 15.5% |
| Immigrants | South America | 76.3 /100 | #154 | Good 15.5% |
| Immigrants | Bangladesh | 76.1 /100 | #155 | Good 15.5% |
| Bermudans | 73.9 /100 | #156 | Good 15.4% |
| Immigrants | Cameroon | 71.7 /100 | #157 | Good 15.4% |
| Immigrants | Poland | 71.5 /100 | #158 | Good 15.4% |
| Luxembourgers | 71.0 /100 | #159 | Good 15.3% |
| Kenyans | 70.3 /100 | #160 | Good 15.3% |
| Sudanese | 68.7 /100 | #161 | Good 15.3% |
| Peruvians | 68.7 /100 | #162 | Good 15.3% |
| Uruguayans | 67.1 /100 | #163 | Good 15.3% |
| Colombians | 66.9 /100 | #164 | Good 15.3% |