Fijian vs Immigrants from Austria Master's Degree
COMPARE
Fijian
Immigrants from Austria
Master's Degree
Master's Degree Comparison
Fijians
Immigrants from Austria
10.3%
MASTER'S DEGREE
0.0/ 100
METRIC RATING
330th/ 347
METRIC RANK
18.8%
MASTER'S DEGREE
100.0/ 100
METRIC RATING
47th/ 347
METRIC RANK
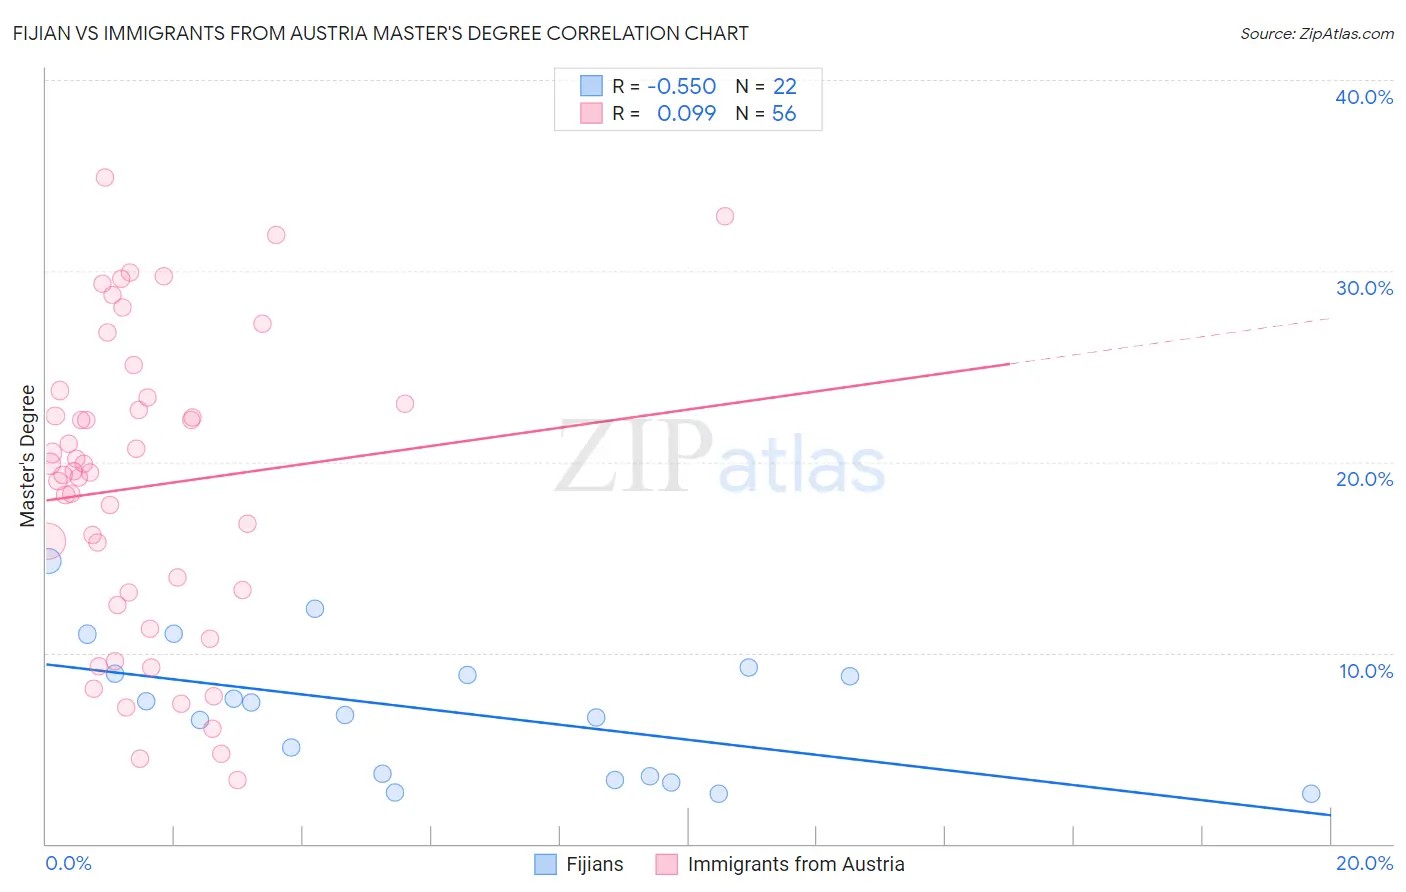
Fijian vs Immigrants from Austria Master's Degree Correlation Chart
The statistical analysis conducted on geographies consisting of 55,944,571 people shows a substantial negative correlation between the proportion of Fijians and percentage of population with at least master's degree education in the United States with a correlation coefficient (R) of -0.550 and weighted average of 10.3%. Similarly, the statistical analysis conducted on geographies consisting of 167,968,334 people shows a slight positive correlation between the proportion of Immigrants from Austria and percentage of population with at least master's degree education in the United States with a correlation coefficient (R) of 0.099 and weighted average of 18.8%, a difference of 82.8%.
Master's Degree Correlation Summary
| Measurement | Fijian | Immigrants from Austria |
| Minimum | 2.6% | 3.4% |
| Maximum | 14.8% | 34.9% |
| Range | 12.2% | 31.5% |
| Mean | 7.0% | 18.7% |
| Median | 7.1% | 19.5% |
| Interquartile 25% (IQ1) | 3.5% | 12.8% |
| Interquartile 75% (IQ3) | 8.9% | 23.2% |
| Interquartile Range (IQR) | 5.4% | 10.4% |
| Standard Deviation (Sample) | 3.4% | 7.9% |
| Standard Deviation (Population) | 3.4% | 7.9% |
Similar Demographics by Master's Degree
Demographics Similar to Fijians by Master's Degree
In terms of master's degree, the demographic groups most similar to Fijians are Pueblo (10.3%, a difference of 0.16%), Immigrants from the Azores (10.2%, a difference of 0.63%), Menominee (10.2%, a difference of 1.0%), Nepalese (10.5%, a difference of 1.7%), and Bangladeshi (10.5%, a difference of 1.8%).
| Demographics | Rating | Rank | Master's Degree |
| Crow | 0.0 /100 | #323 | Tragic 10.6% |
| Dutch West Indians | 0.0 /100 | #324 | Tragic 10.6% |
| Inupiat | 0.0 /100 | #325 | Tragic 10.5% |
| Creek | 0.0 /100 | #326 | Tragic 10.5% |
| Paiute | 0.0 /100 | #327 | Tragic 10.5% |
| Bangladeshis | 0.0 /100 | #328 | Tragic 10.5% |
| Nepalese | 0.0 /100 | #329 | Tragic 10.5% |
| Fijians | 0.0 /100 | #330 | Tragic 10.3% |
| Pueblo | 0.0 /100 | #331 | Tragic 10.3% |
| Immigrants | Azores | 0.0 /100 | #332 | Tragic 10.2% |
| Menominee | 0.0 /100 | #333 | Tragic 10.2% |
| Arapaho | 0.0 /100 | #334 | Tragic 10.0% |
| Immigrants | Central America | 0.0 /100 | #335 | Tragic 10.0% |
| Natives/Alaskans | 0.0 /100 | #336 | Tragic 9.9% |
| Mexicans | 0.0 /100 | #337 | Tragic 9.7% |
Demographics Similar to Immigrants from Austria by Master's Degree
In terms of master's degree, the demographic groups most similar to Immigrants from Austria are Immigrants from Norway (18.8%, a difference of 0.010%), Paraguayan (18.8%, a difference of 0.060%), Estonian (18.8%, a difference of 0.16%), Bulgarian (18.8%, a difference of 0.34%), and Immigrants from South Africa (18.8%, a difference of 0.35%).
| Demographics | Rating | Rank | Master's Degree |
| Immigrants | Bolivia | 100.0 /100 | #40 | Exceptional 19.1% |
| Immigrants | Latvia | 100.0 /100 | #41 | Exceptional 19.1% |
| Immigrants | Saudi Arabia | 100.0 /100 | #42 | Exceptional 19.0% |
| Immigrants | Greece | 100.0 /100 | #43 | Exceptional 19.0% |
| Immigrants | Malaysia | 100.0 /100 | #44 | Exceptional 18.9% |
| Immigrants | Belarus | 100.0 /100 | #45 | Exceptional 18.9% |
| Immigrants | Norway | 100.0 /100 | #46 | Exceptional 18.8% |
| Immigrants | Austria | 100.0 /100 | #47 | Exceptional 18.8% |
| Paraguayans | 100.0 /100 | #48 | Exceptional 18.8% |
| Estonians | 100.0 /100 | #49 | Exceptional 18.8% |
| Bulgarians | 100.0 /100 | #50 | Exceptional 18.8% |
| Immigrants | South Africa | 100.0 /100 | #51 | Exceptional 18.8% |
| Immigrants | Kuwait | 100.0 /100 | #52 | Exceptional 18.6% |
| Immigrants | Czechoslovakia | 99.9 /100 | #53 | Exceptional 18.5% |
| Immigrants | Lithuania | 99.9 /100 | #54 | Exceptional 18.5% |