Fijian vs Welsh Master's Degree
COMPARE
Fijian
Welsh
Master's Degree
Master's Degree Comparison
Fijians
Welsh
10.3%
MASTER'S DEGREE
0.0/ 100
METRIC RATING
330th/ 347
METRIC RANK
14.6%
MASTER'S DEGREE
34.2/ 100
METRIC RATING
191st/ 347
METRIC RANK
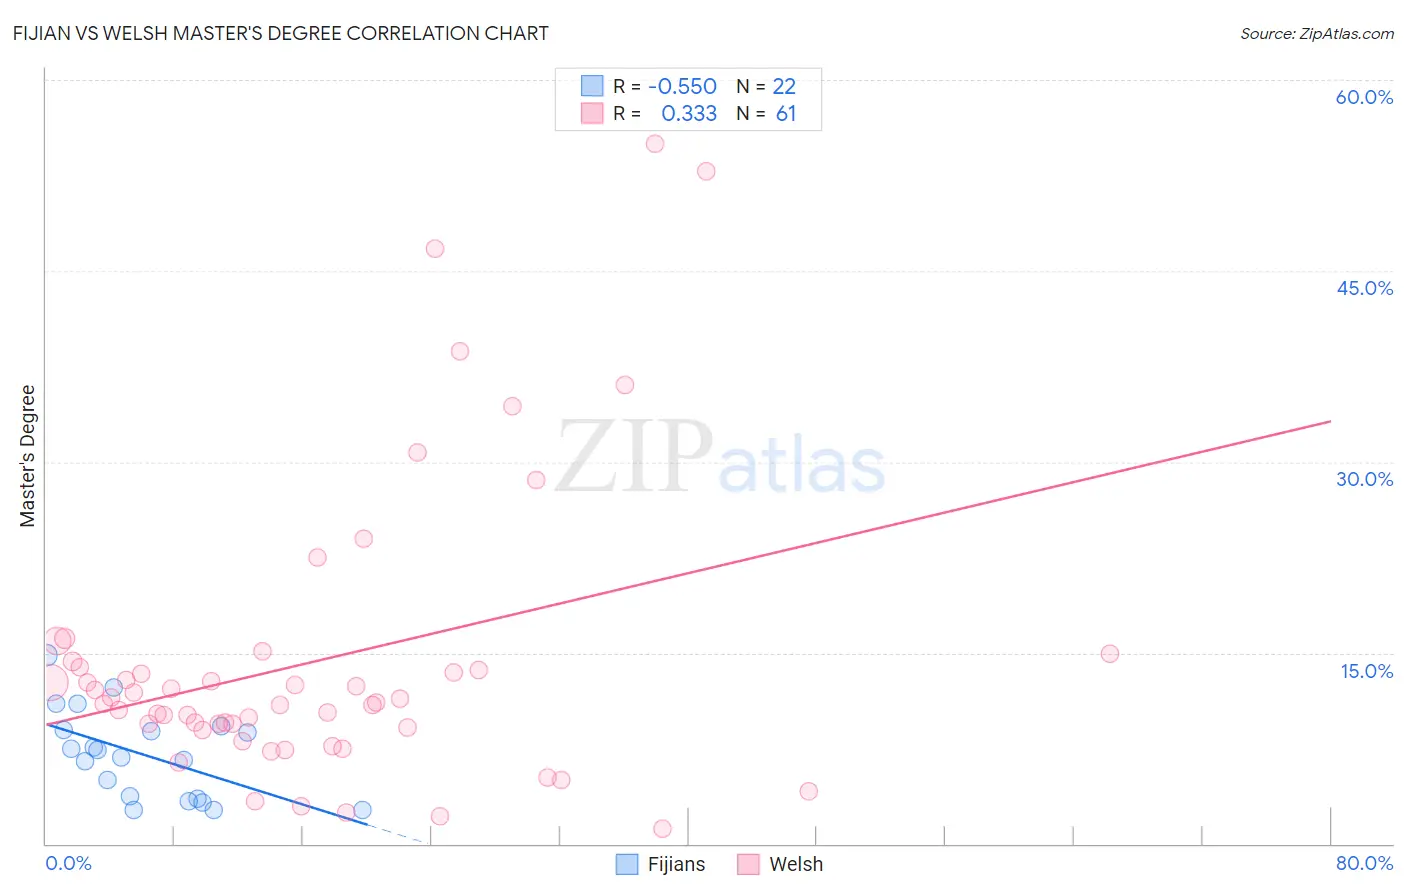
Fijian vs Welsh Master's Degree Correlation Chart
The statistical analysis conducted on geographies consisting of 55,944,571 people shows a substantial negative correlation between the proportion of Fijians and percentage of population with at least master's degree education in the United States with a correlation coefficient (R) of -0.550 and weighted average of 10.3%. Similarly, the statistical analysis conducted on geographies consisting of 528,158,256 people shows a mild positive correlation between the proportion of Welsh and percentage of population with at least master's degree education in the United States with a correlation coefficient (R) of 0.333 and weighted average of 14.6%, a difference of 41.9%.
Master's Degree Correlation Summary
| Measurement | Fijian | Welsh |
| Minimum | 2.6% | 1.2% |
| Maximum | 14.8% | 55.0% |
| Range | 12.2% | 53.8% |
| Mean | 7.0% | 14.4% |
| Median | 7.1% | 11.1% |
| Interquartile 25% (IQ1) | 3.5% | 9.0% |
| Interquartile 75% (IQ3) | 8.9% | 14.1% |
| Interquartile Range (IQR) | 5.4% | 5.1% |
| Standard Deviation (Sample) | 3.4% | 11.5% |
| Standard Deviation (Population) | 3.4% | 11.4% |
Similar Demographics by Master's Degree
Demographics Similar to Fijians by Master's Degree
In terms of master's degree, the demographic groups most similar to Fijians are Pueblo (10.3%, a difference of 0.16%), Immigrants from the Azores (10.2%, a difference of 0.63%), Menominee (10.2%, a difference of 1.0%), Nepalese (10.5%, a difference of 1.7%), and Bangladeshi (10.5%, a difference of 1.8%).
| Demographics | Rating | Rank | Master's Degree |
| Crow | 0.0 /100 | #323 | Tragic 10.6% |
| Dutch West Indians | 0.0 /100 | #324 | Tragic 10.6% |
| Inupiat | 0.0 /100 | #325 | Tragic 10.5% |
| Creek | 0.0 /100 | #326 | Tragic 10.5% |
| Paiute | 0.0 /100 | #327 | Tragic 10.5% |
| Bangladeshis | 0.0 /100 | #328 | Tragic 10.5% |
| Nepalese | 0.0 /100 | #329 | Tragic 10.5% |
| Fijians | 0.0 /100 | #330 | Tragic 10.3% |
| Pueblo | 0.0 /100 | #331 | Tragic 10.3% |
| Immigrants | Azores | 0.0 /100 | #332 | Tragic 10.2% |
| Menominee | 0.0 /100 | #333 | Tragic 10.2% |
| Arapaho | 0.0 /100 | #334 | Tragic 10.0% |
| Immigrants | Central America | 0.0 /100 | #335 | Tragic 10.0% |
| Natives/Alaskans | 0.0 /100 | #336 | Tragic 9.9% |
| Mexicans | 0.0 /100 | #337 | Tragic 9.7% |
Demographics Similar to Welsh by Master's Degree
In terms of master's degree, the demographic groups most similar to Welsh are Immigrants from Middle Africa (14.6%, a difference of 0.090%), Immigrants from Nigeria (14.6%, a difference of 0.22%), Spaniard (14.6%, a difference of 0.23%), Immigrants (14.6%, a difference of 0.25%), and Chinese (14.6%, a difference of 0.26%).
| Demographics | Rating | Rank | Master's Degree |
| Immigrants | Zaire | 39.5 /100 | #184 | Fair 14.7% |
| Barbadians | 38.3 /100 | #185 | Fair 14.7% |
| Immigrants | Oceania | 37.1 /100 | #186 | Fair 14.7% |
| Basques | 36.5 /100 | #187 | Fair 14.7% |
| Immigrants | Costa Rica | 36.2 /100 | #188 | Fair 14.7% |
| Immigrants | Immigrants | 36.0 /100 | #189 | Fair 14.6% |
| Spaniards | 35.8 /100 | #190 | Fair 14.6% |
| Welsh | 34.2 /100 | #191 | Fair 14.6% |
| Immigrants | Middle Africa | 33.6 /100 | #192 | Fair 14.6% |
| Immigrants | Nigeria | 32.7 /100 | #193 | Fair 14.6% |
| Chinese | 32.5 /100 | #194 | Fair 14.6% |
| Danes | 31.3 /100 | #195 | Fair 14.5% |
| Czechoslovakians | 29.9 /100 | #196 | Fair 14.5% |
| Belgians | 28.0 /100 | #197 | Fair 14.5% |
| West Indians | 27.4 /100 | #198 | Fair 14.5% |