Fijian vs Immigrants from Canada 10th Grade
COMPARE
Fijian
Immigrants from Canada
10th Grade
10th Grade Comparison
Fijians
Immigrants from Canada
91.5%
10TH GRADE
0.0/ 100
METRIC RATING
297th/ 347
METRIC RANK
95.1%
10TH GRADE
99.8/ 100
METRIC RATING
50th/ 347
METRIC RANK
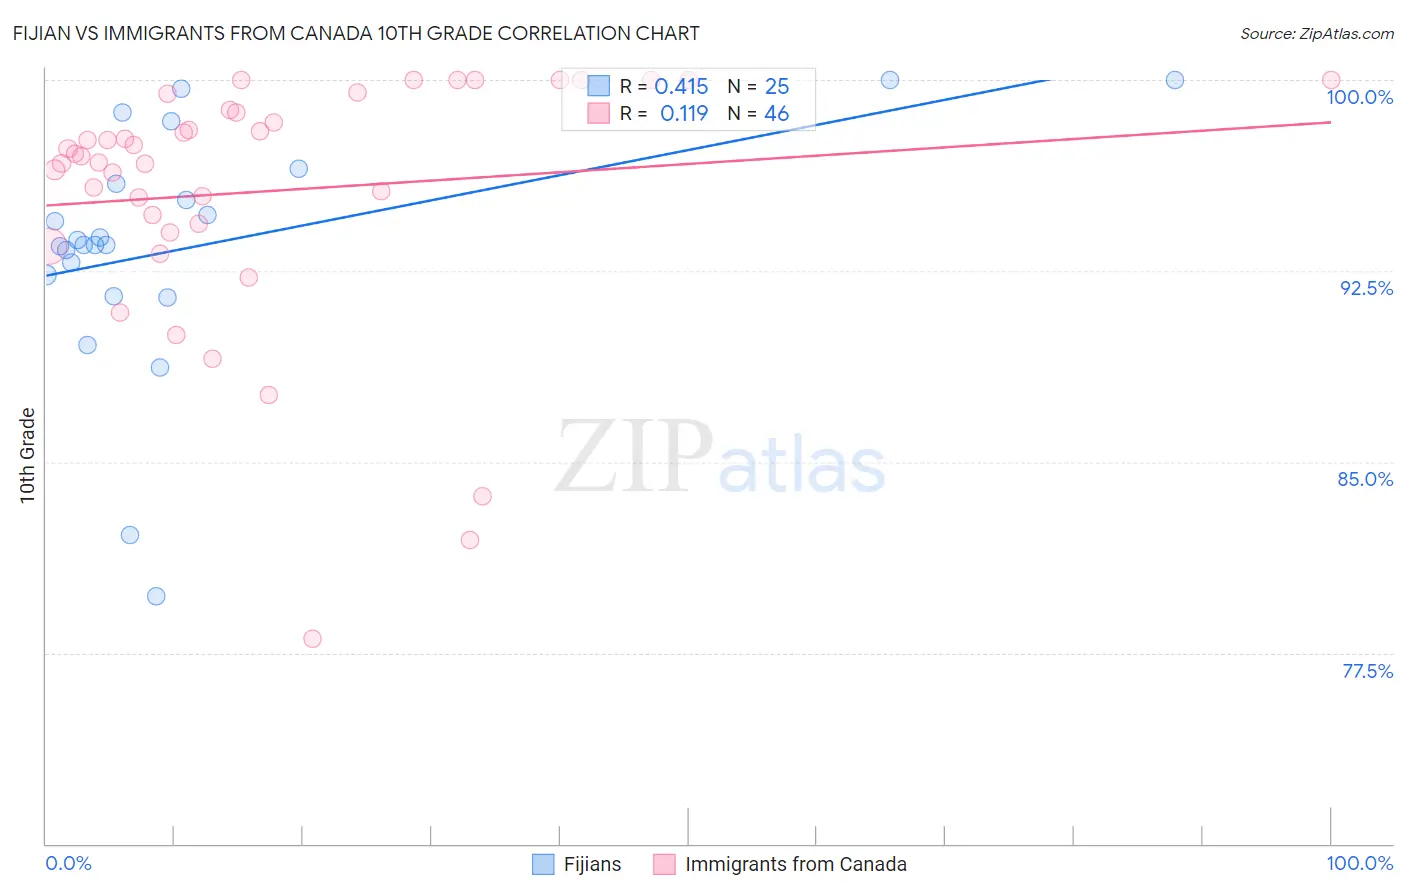
Fijian vs Immigrants from Canada 10th Grade Correlation Chart
The statistical analysis conducted on geographies consisting of 55,948,842 people shows a moderate positive correlation between the proportion of Fijians and percentage of population with at least 10th grade education in the United States with a correlation coefficient (R) of 0.415 and weighted average of 91.5%. Similarly, the statistical analysis conducted on geographies consisting of 459,397,383 people shows a poor positive correlation between the proportion of Immigrants from Canada and percentage of population with at least 10th grade education in the United States with a correlation coefficient (R) of 0.119 and weighted average of 95.1%, a difference of 3.9%.
10th Grade Correlation Summary
| Measurement | Fijian | Immigrants from Canada |
| Minimum | 79.7% | 78.1% |
| Maximum | 100.0% | 100.0% |
| Range | 20.3% | 21.9% |
| Mean | 93.5% | 95.6% |
| Median | 93.5% | 97.0% |
| Interquartile 25% (IQ1) | 91.9% | 94.4% |
| Interquartile 75% (IQ3) | 96.2% | 98.8% |
| Interquartile Range (IQR) | 4.3% | 4.5% |
| Standard Deviation (Sample) | 4.8% | 4.9% |
| Standard Deviation (Population) | 4.7% | 4.9% |
Similar Demographics by 10th Grade
Demographics Similar to Fijians by 10th Grade
In terms of 10th grade, the demographic groups most similar to Fijians are Cuban (91.5%, a difference of 0.020%), Immigrants from Haiti (91.4%, a difference of 0.10%), Immigrants from Grenada (91.6%, a difference of 0.14%), Guyanese (91.4%, a difference of 0.15%), and Lumbee (91.7%, a difference of 0.27%).
| Demographics | Rating | Rank | 10th Grade |
| British West Indians | 0.0 /100 | #290 | Tragic 91.8% |
| Immigrants | West Indies | 0.0 /100 | #291 | Tragic 91.8% |
| Immigrants | Burma/Myanmar | 0.0 /100 | #292 | Tragic 91.8% |
| Indonesians | 0.0 /100 | #293 | Tragic 91.8% |
| Haitians | 0.0 /100 | #294 | Tragic 91.8% |
| Lumbee | 0.0 /100 | #295 | Tragic 91.7% |
| Immigrants | Grenada | 0.0 /100 | #296 | Tragic 91.6% |
| Fijians | 0.0 /100 | #297 | Tragic 91.5% |
| Cubans | 0.0 /100 | #298 | Tragic 91.5% |
| Immigrants | Haiti | 0.0 /100 | #299 | Tragic 91.4% |
| Guyanese | 0.0 /100 | #300 | Tragic 91.4% |
| Japanese | 0.0 /100 | #301 | Tragic 91.2% |
| Immigrants | Guyana | 0.0 /100 | #302 | Tragic 91.2% |
| Immigrants | Vietnam | 0.0 /100 | #303 | Tragic 91.2% |
| Pima | 0.0 /100 | #304 | Tragic 91.2% |
Demographics Similar to Immigrants from Canada by 10th Grade
In terms of 10th grade, the demographic groups most similar to Immigrants from Canada are Austrian (95.1%, a difference of 0.010%), Ottawa (95.1%, a difference of 0.010%), Immigrants from North America (95.0%, a difference of 0.020%), Immigrants from Austria (95.1%, a difference of 0.030%), and Immigrants from Lithuania (95.0%, a difference of 0.040%).
| Demographics | Rating | Rank | 10th Grade |
| Macedonians | 99.9 /100 | #43 | Exceptional 95.2% |
| Immigrants | Northern Europe | 99.9 /100 | #44 | Exceptional 95.2% |
| Greeks | 99.9 /100 | #45 | Exceptional 95.2% |
| Czechoslovakians | 99.9 /100 | #46 | Exceptional 95.1% |
| Serbians | 99.9 /100 | #47 | Exceptional 95.1% |
| Australians | 99.9 /100 | #48 | Exceptional 95.1% |
| Immigrants | Austria | 99.9 /100 | #49 | Exceptional 95.1% |
| Immigrants | Canada | 99.8 /100 | #50 | Exceptional 95.1% |
| Austrians | 99.8 /100 | #51 | Exceptional 95.1% |
| Ottawa | 99.8 /100 | #52 | Exceptional 95.1% |
| Immigrants | North America | 99.8 /100 | #53 | Exceptional 95.0% |
| Immigrants | Lithuania | 99.8 /100 | #54 | Exceptional 95.0% |
| Immigrants | Ireland | 99.8 /100 | #55 | Exceptional 95.0% |
| New Zealanders | 99.8 /100 | #56 | Exceptional 95.0% |
| Ukrainians | 99.8 /100 | #57 | Exceptional 95.0% |