Guatemalan vs Immigrants from Europe Master's Degree
COMPARE
Guatemalan
Immigrants from Europe
Master's Degree
Master's Degree Comparison
Guatemalans
Immigrants from Europe
11.7%
MASTER'S DEGREE
0.1/ 100
METRIC RATING
289th/ 347
METRIC RANK
18.2%
MASTER'S DEGREE
99.9/ 100
METRIC RATING
61st/ 347
METRIC RANK
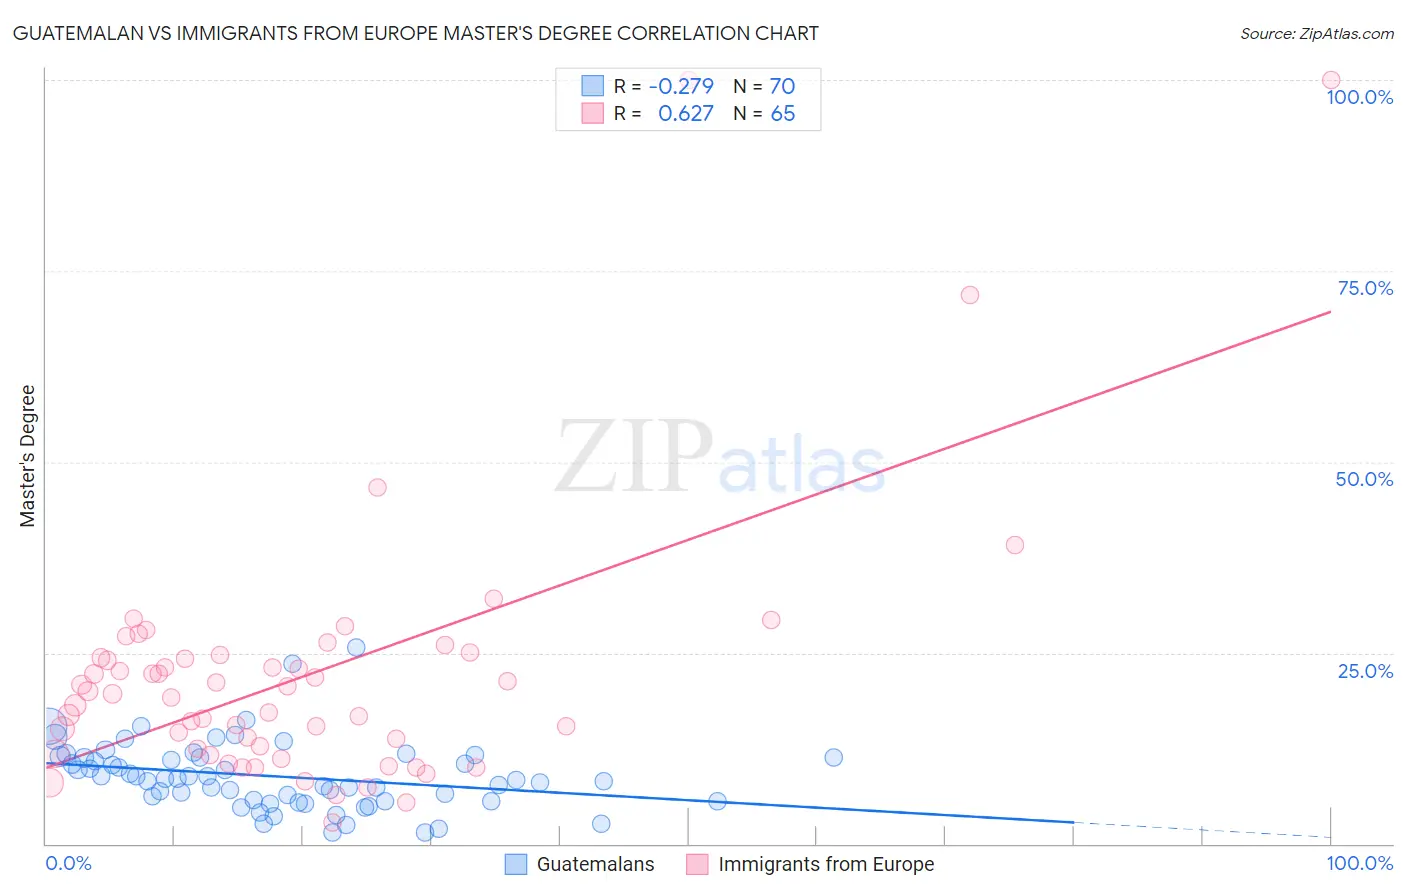
Guatemalan vs Immigrants from Europe Master's Degree Correlation Chart
The statistical analysis conducted on geographies consisting of 409,354,875 people shows a weak negative correlation between the proportion of Guatemalans and percentage of population with at least master's degree education in the United States with a correlation coefficient (R) of -0.279 and weighted average of 11.7%. Similarly, the statistical analysis conducted on geographies consisting of 547,023,037 people shows a significant positive correlation between the proportion of Immigrants from Europe and percentage of population with at least master's degree education in the United States with a correlation coefficient (R) of 0.627 and weighted average of 18.2%, a difference of 55.3%.
Master's Degree Correlation Summary
| Measurement | Guatemalan | Immigrants from Europe |
| Minimum | 1.5% | 2.7% |
| Maximum | 25.7% | 100.0% |
| Range | 24.2% | 97.3% |
| Mean | 8.8% | 22.0% |
| Median | 8.4% | 19.6% |
| Interquartile 25% (IQ1) | 5.5% | 12.1% |
| Interquartile 75% (IQ3) | 11.2% | 24.5% |
| Interquartile Range (IQR) | 5.7% | 12.5% |
| Standard Deviation (Sample) | 4.5% | 17.5% |
| Standard Deviation (Population) | 4.4% | 17.3% |
Similar Demographics by Master's Degree
Demographics Similar to Guatemalans by Master's Degree
In terms of master's degree, the demographic groups most similar to Guatemalans are Immigrants from Honduras (11.8%, a difference of 0.080%), Ute (11.7%, a difference of 0.24%), Immigrants from Haiti (11.8%, a difference of 0.25%), Aleut (11.8%, a difference of 0.44%), and Immigrants from Nicaragua (11.8%, a difference of 0.80%).
| Demographics | Rating | Rank | Master's Degree |
| Immigrants | El Salvador | 0.2 /100 | #282 | Tragic 12.0% |
| Hondurans | 0.2 /100 | #283 | Tragic 11.9% |
| Ottawa | 0.2 /100 | #284 | Tragic 11.9% |
| Immigrants | Nicaragua | 0.2 /100 | #285 | Tragic 11.8% |
| Aleuts | 0.1 /100 | #286 | Tragic 11.8% |
| Immigrants | Haiti | 0.1 /100 | #287 | Tragic 11.8% |
| Immigrants | Honduras | 0.1 /100 | #288 | Tragic 11.8% |
| Guatemalans | 0.1 /100 | #289 | Tragic 11.7% |
| Ute | 0.1 /100 | #290 | Tragic 11.7% |
| Colville | 0.1 /100 | #291 | Tragic 11.6% |
| Immigrants | Guatemala | 0.1 /100 | #292 | Tragic 11.6% |
| Alaska Natives | 0.1 /100 | #293 | Tragic 11.6% |
| Hawaiians | 0.1 /100 | #294 | Tragic 11.6% |
| Marshallese | 0.1 /100 | #295 | Tragic 11.6% |
| Alaskan Athabascans | 0.1 /100 | #296 | Tragic 11.6% |
Demographics Similar to Immigrants from Europe by Master's Degree
In terms of master's degree, the demographic groups most similar to Immigrants from Europe are New Zealander (18.3%, a difference of 0.15%), Argentinean (18.2%, a difference of 0.36%), Immigrants from Bulgaria (18.3%, a difference of 0.38%), Immigrants from Netherlands (18.1%, a difference of 0.72%), and South African (18.1%, a difference of 0.80%).
| Demographics | Rating | Rank | Master's Degree |
| Immigrants | Lithuania | 99.9 /100 | #54 | Exceptional 18.5% |
| Immigrants | Serbia | 99.9 /100 | #55 | Exceptional 18.5% |
| Asians | 99.9 /100 | #56 | Exceptional 18.4% |
| Immigrants | Asia | 99.9 /100 | #57 | Exceptional 18.4% |
| Australians | 99.9 /100 | #58 | Exceptional 18.4% |
| Immigrants | Bulgaria | 99.9 /100 | #59 | Exceptional 18.3% |
| New Zealanders | 99.9 /100 | #60 | Exceptional 18.3% |
| Immigrants | Europe | 99.9 /100 | #61 | Exceptional 18.2% |
| Argentineans | 99.9 /100 | #62 | Exceptional 18.2% |
| Immigrants | Netherlands | 99.9 /100 | #63 | Exceptional 18.1% |
| South Africans | 99.9 /100 | #64 | Exceptional 18.1% |
| Immigrants | Kazakhstan | 99.8 /100 | #65 | Exceptional 18.0% |
| Ethiopians | 99.8 /100 | #66 | Exceptional 18.0% |
| Immigrants | Argentina | 99.8 /100 | #67 | Exceptional 18.0% |
| Immigrants | Ethiopia | 99.8 /100 | #68 | Exceptional 17.9% |