Immigrants from Egypt vs Immigrants from Europe Master's Degree
COMPARE
Immigrants from Egypt
Immigrants from Europe
Master's Degree
Master's Degree Comparison
Immigrants from Egypt
Immigrants from Europe
17.2%
MASTER'S DEGREE
99.1/ 100
METRIC RATING
90th/ 347
METRIC RANK
18.2%
MASTER'S DEGREE
99.9/ 100
METRIC RATING
61st/ 347
METRIC RANK
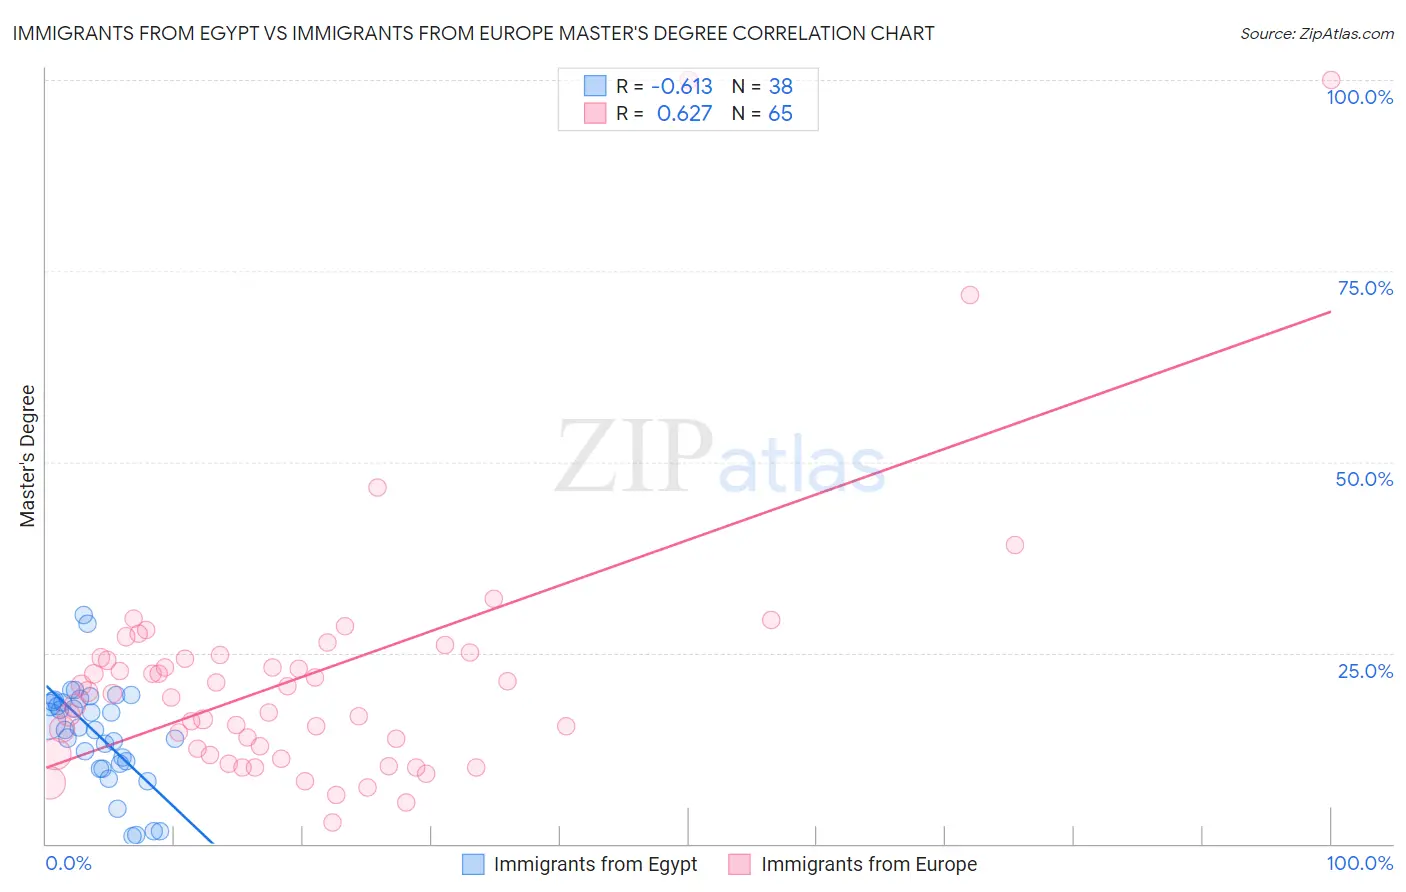
Immigrants from Egypt vs Immigrants from Europe Master's Degree Correlation Chart
The statistical analysis conducted on geographies consisting of 245,464,462 people shows a significant negative correlation between the proportion of Immigrants from Egypt and percentage of population with at least master's degree education in the United States with a correlation coefficient (R) of -0.613 and weighted average of 17.2%. Similarly, the statistical analysis conducted on geographies consisting of 547,023,037 people shows a significant positive correlation between the proportion of Immigrants from Europe and percentage of population with at least master's degree education in the United States with a correlation coefficient (R) of 0.627 and weighted average of 18.2%, a difference of 6.2%.
Master's Degree Correlation Summary
| Measurement | Immigrants from Egypt | Immigrants from Europe |
| Minimum | 1.0% | 2.7% |
| Maximum | 29.9% | 100.0% |
| Range | 28.9% | 97.3% |
| Mean | 14.3% | 22.0% |
| Median | 15.1% | 19.6% |
| Interquartile 25% (IQ1) | 10.4% | 12.1% |
| Interquartile 75% (IQ3) | 18.7% | 24.5% |
| Interquartile Range (IQR) | 8.2% | 12.5% |
| Standard Deviation (Sample) | 6.7% | 17.5% |
| Standard Deviation (Population) | 6.6% | 17.3% |
Similar Demographics by Master's Degree
Demographics Similar to Immigrants from Egypt by Master's Degree
In terms of master's degree, the demographic groups most similar to Immigrants from Egypt are Bhutanese (17.2%, a difference of 0.020%), Romanian (17.2%, a difference of 0.070%), Immigrants from Canada (17.2%, a difference of 0.090%), Immigrants from North America (17.2%, a difference of 0.12%), and Immigrants from Italy (17.2%, a difference of 0.18%).
| Demographics | Rating | Rank | Master's Degree |
| Immigrants | Zimbabwe | 99.5 /100 | #83 | Exceptional 17.4% |
| Immigrants | Scotland | 99.4 /100 | #84 | Exceptional 17.4% |
| Immigrants | Brazil | 99.4 /100 | #85 | Exceptional 17.4% |
| Immigrants | Croatia | 99.3 /100 | #86 | Exceptional 17.3% |
| Maltese | 99.3 /100 | #87 | Exceptional 17.3% |
| Immigrants | Canada | 99.2 /100 | #88 | Exceptional 17.2% |
| Bhutanese | 99.1 /100 | #89 | Exceptional 17.2% |
| Immigrants | Egypt | 99.1 /100 | #90 | Exceptional 17.2% |
| Romanians | 99.1 /100 | #91 | Exceptional 17.2% |
| Immigrants | North America | 99.1 /100 | #92 | Exceptional 17.2% |
| Immigrants | Italy | 99.1 /100 | #93 | Exceptional 17.2% |
| Ugandans | 99.0 /100 | #94 | Exceptional 17.1% |
| Immigrants | Morocco | 98.9 /100 | #95 | Exceptional 17.1% |
| Immigrants | Northern Africa | 98.9 /100 | #96 | Exceptional 17.1% |
| Immigrants | England | 98.8 /100 | #97 | Exceptional 17.0% |
Demographics Similar to Immigrants from Europe by Master's Degree
In terms of master's degree, the demographic groups most similar to Immigrants from Europe are New Zealander (18.3%, a difference of 0.15%), Argentinean (18.2%, a difference of 0.36%), Immigrants from Bulgaria (18.3%, a difference of 0.38%), Immigrants from Netherlands (18.1%, a difference of 0.72%), and South African (18.1%, a difference of 0.80%).
| Demographics | Rating | Rank | Master's Degree |
| Immigrants | Lithuania | 99.9 /100 | #54 | Exceptional 18.5% |
| Immigrants | Serbia | 99.9 /100 | #55 | Exceptional 18.5% |
| Asians | 99.9 /100 | #56 | Exceptional 18.4% |
| Immigrants | Asia | 99.9 /100 | #57 | Exceptional 18.4% |
| Australians | 99.9 /100 | #58 | Exceptional 18.4% |
| Immigrants | Bulgaria | 99.9 /100 | #59 | Exceptional 18.3% |
| New Zealanders | 99.9 /100 | #60 | Exceptional 18.3% |
| Immigrants | Europe | 99.9 /100 | #61 | Exceptional 18.2% |
| Argentineans | 99.9 /100 | #62 | Exceptional 18.2% |
| Immigrants | Netherlands | 99.9 /100 | #63 | Exceptional 18.1% |
| South Africans | 99.9 /100 | #64 | Exceptional 18.1% |
| Immigrants | Kazakhstan | 99.8 /100 | #65 | Exceptional 18.0% |
| Ethiopians | 99.8 /100 | #66 | Exceptional 18.0% |
| Immigrants | Argentina | 99.8 /100 | #67 | Exceptional 18.0% |
| Immigrants | Ethiopia | 99.8 /100 | #68 | Exceptional 17.9% |