Comanche vs Immigrants from Austria Master's Degree
COMPARE
Comanche
Immigrants from Austria
Master's Degree
Master's Degree Comparison
Comanche
Immigrants from Austria
12.1%
MASTER'S DEGREE
0.3/ 100
METRIC RATING
272nd/ 347
METRIC RANK
18.8%
MASTER'S DEGREE
100.0/ 100
METRIC RATING
47th/ 347
METRIC RANK
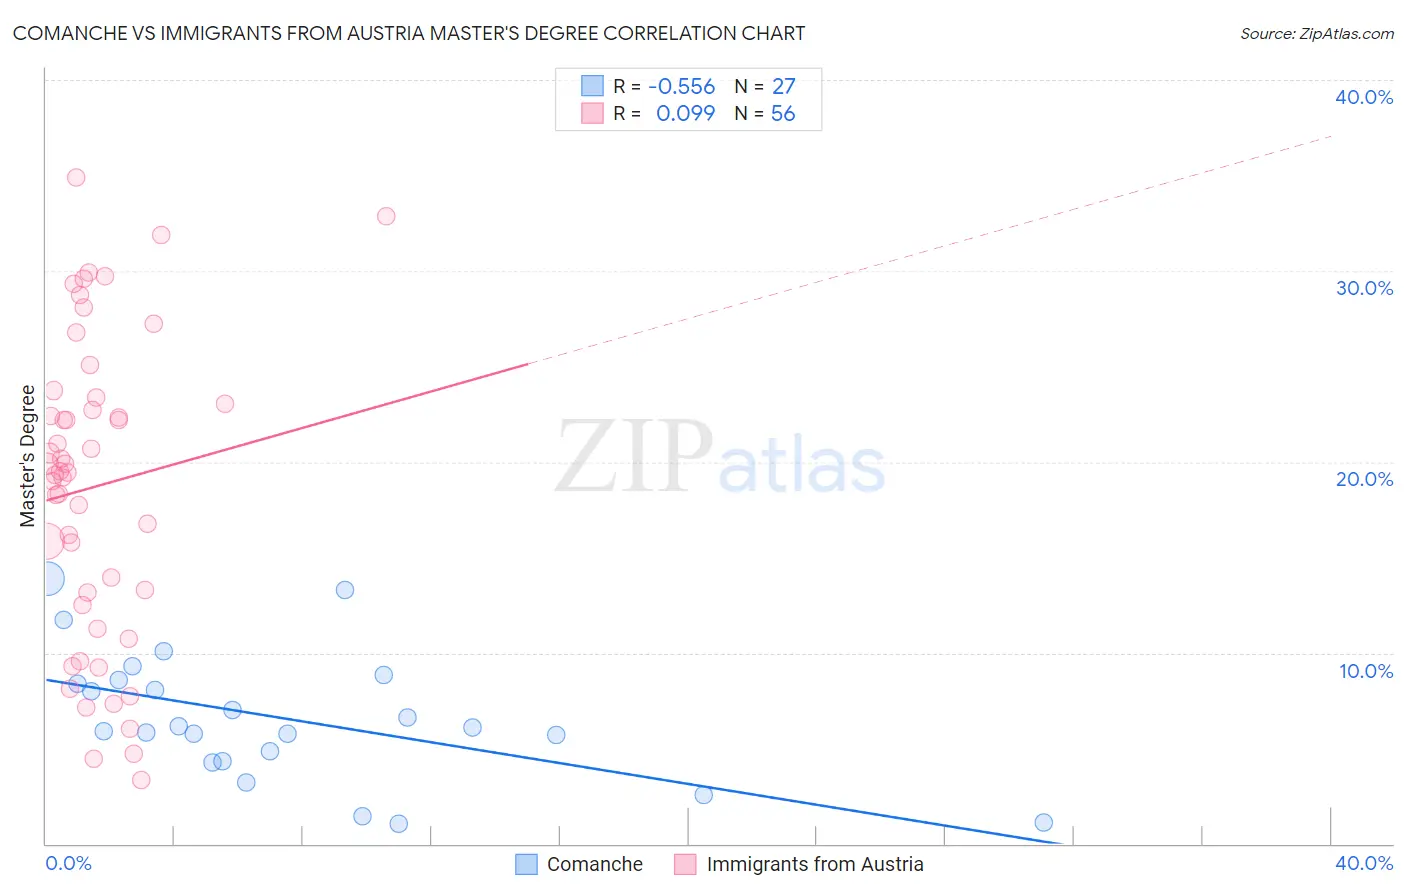
Comanche vs Immigrants from Austria Master's Degree Correlation Chart
The statistical analysis conducted on geographies consisting of 109,770,893 people shows a substantial negative correlation between the proportion of Comanche and percentage of population with at least master's degree education in the United States with a correlation coefficient (R) of -0.556 and weighted average of 12.1%. Similarly, the statistical analysis conducted on geographies consisting of 167,968,334 people shows a slight positive correlation between the proportion of Immigrants from Austria and percentage of population with at least master's degree education in the United States with a correlation coefficient (R) of 0.099 and weighted average of 18.8%, a difference of 55.6%.
Master's Degree Correlation Summary
| Measurement | Comanche | Immigrants from Austria |
| Minimum | 1.0% | 3.4% |
| Maximum | 13.9% | 34.9% |
| Range | 12.9% | 31.5% |
| Mean | 6.6% | 18.7% |
| Median | 6.1% | 19.5% |
| Interquartile 25% (IQ1) | 4.3% | 12.8% |
| Interquartile 75% (IQ3) | 8.6% | 23.2% |
| Interquartile Range (IQR) | 4.3% | 10.4% |
| Standard Deviation (Sample) | 3.4% | 7.9% |
| Standard Deviation (Population) | 3.3% | 7.9% |
Similar Demographics by Master's Degree
Demographics Similar to Comanche by Master's Degree
In terms of master's degree, the demographic groups most similar to Comanche are Haitian (12.1%, a difference of 0.060%), Blackfeet (12.1%, a difference of 0.090%), Cape Verdean (12.1%, a difference of 0.18%), Cuban (12.1%, a difference of 0.20%), and Black/African American (12.1%, a difference of 0.25%).
| Demographics | Rating | Rank | Master's Degree |
| Immigrants | Fiji | 0.5 /100 | #265 | Tragic 12.4% |
| Bahamians | 0.5 /100 | #266 | Tragic 12.4% |
| Americans | 0.4 /100 | #267 | Tragic 12.3% |
| Native Hawaiians | 0.4 /100 | #268 | Tragic 12.3% |
| Central Americans | 0.3 /100 | #269 | Tragic 12.2% |
| Salvadorans | 0.3 /100 | #270 | Tragic 12.2% |
| Haitians | 0.3 /100 | #271 | Tragic 12.1% |
| Comanche | 0.3 /100 | #272 | Tragic 12.1% |
| Blackfeet | 0.3 /100 | #273 | Tragic 12.1% |
| Cape Verdeans | 0.3 /100 | #274 | Tragic 12.1% |
| Cubans | 0.3 /100 | #275 | Tragic 12.1% |
| Blacks/African Americans | 0.3 /100 | #276 | Tragic 12.1% |
| Immigrants | Caribbean | 0.3 /100 | #277 | Tragic 12.1% |
| Potawatomi | 0.3 /100 | #278 | Tragic 12.1% |
| Immigrants | Belize | 0.2 /100 | #279 | Tragic 12.1% |
Demographics Similar to Immigrants from Austria by Master's Degree
In terms of master's degree, the demographic groups most similar to Immigrants from Austria are Immigrants from Norway (18.8%, a difference of 0.010%), Paraguayan (18.8%, a difference of 0.060%), Estonian (18.8%, a difference of 0.16%), Bulgarian (18.8%, a difference of 0.34%), and Immigrants from South Africa (18.8%, a difference of 0.35%).
| Demographics | Rating | Rank | Master's Degree |
| Immigrants | Bolivia | 100.0 /100 | #40 | Exceptional 19.1% |
| Immigrants | Latvia | 100.0 /100 | #41 | Exceptional 19.1% |
| Immigrants | Saudi Arabia | 100.0 /100 | #42 | Exceptional 19.0% |
| Immigrants | Greece | 100.0 /100 | #43 | Exceptional 19.0% |
| Immigrants | Malaysia | 100.0 /100 | #44 | Exceptional 18.9% |
| Immigrants | Belarus | 100.0 /100 | #45 | Exceptional 18.9% |
| Immigrants | Norway | 100.0 /100 | #46 | Exceptional 18.8% |
| Immigrants | Austria | 100.0 /100 | #47 | Exceptional 18.8% |
| Paraguayans | 100.0 /100 | #48 | Exceptional 18.8% |
| Estonians | 100.0 /100 | #49 | Exceptional 18.8% |
| Bulgarians | 100.0 /100 | #50 | Exceptional 18.8% |
| Immigrants | South Africa | 100.0 /100 | #51 | Exceptional 18.8% |
| Immigrants | Kuwait | 100.0 /100 | #52 | Exceptional 18.6% |
| Immigrants | Czechoslovakia | 99.9 /100 | #53 | Exceptional 18.5% |
| Immigrants | Lithuania | 99.9 /100 | #54 | Exceptional 18.5% |