South American vs Immigrants from Austria Master's Degree

COMPARE

South American
Race
Ancestry
AfghanAfricanAlaska NativeAlaskan AthabascanAlbanianAleutAlsatianAmericanApacheArabArapahoArgentineanArmenianAssyrian/Chaldean/SyriacAustralianAustrianBahamianBangladeshiBarbadianBasqueBelgianBelizeanBermudanBhutaneseBlackfeetBolivianBrazilianBritishBritish West IndianBulgarianBurmeseCajunCambodianCanadianCape VerdeanCarpatho RusynCelticCentral AmericanCentral American IndianCherokeeCheyenneChickasawChileanChineseChippewaChoctawColombianColvilleComancheCosta RicanCreeCreekCroatianCrowCubanCypriotCzechCzechoslovakianDanishDelawareDominicanDutchDutch West IndianEastern EuropeanEcuadorianEgyptianEnglishEstonianEthiopianEuropeanFijianFilipinoFinnishFrenchFrench American IndianFrench CanadianGermanGerman RussianGhanaianGreekGuamanian/ChamorroGuatemalanGuyaneseHaitianHmongHonduranHopiHoumaHungarianIcelanderIndian (Asian)IndonesianInupiatIranianIraqiIrishIroquoisIsraeliItalianJamaicanJapaneseJordanianKenyanKiowaKoreanLaotianLatvianLebaneseLiberianLithuanianLumbeeLuxembourgerMacedonianMalaysianMalteseMarshalleseMenomineeMexicanMexican American IndianMongolianMoroccanNative HawaiianNavajoNepaleseNew ZealanderNicaraguanNigerianNorthern EuropeanNorwegianOkinawanOsageOttawaPaiutePakistaniPalestinianPanamanianParaguayanPennsylvania GermanPeruvianPimaPolishPortuguesePotawatomiPuebloPuerto RicanPuget Sound SalishRomanianRussianSalvadoranSamoanScandinavianScotch-IrishScottishSeminoleSenegaleseSerbianShoshoneSierra LeoneanSiouxSlavicSlovakSloveneSomaliSouth AfricanSouth AmericanSouth American IndianSoviet UnionSpaniardSpanishSpanish AmericanSpanish American IndianSri LankanSubsaharan AfricanSudaneseSwedishSwissSyrianTaiwaneseThaiTlingit-HaidaTohono O'OdhamTonganTrinidadian and TobagonianTsimshianTurkishU.S. Virgin IslanderUgandanUkrainianUruguayanUteVenezuelanVietnameseWelshWest IndianYakamaYaquiYugoslavianYumanYup'ikZimbabwean
Immigration
NonimmigrantsImmigrantsAfghanistanAfricaAlbaniaArgentinaArmeniaAsiaAustraliaBahamasBangladeshBarbadosBelarusBelgiumBelizeBoliviaBosnia and HerzegovinaBrazilBulgariaBurma/MyanmarCabo VerdeCambodiaCameroonCanadaCaribbeanCentral AmericaChileChinaColombiaCongoCosta RicaCroatiaCubaCzechoslovakiaDenmarkDominicaDominican RepublicEastern AfricaEastern AsiaEastern EuropeEcuadorEgyptEl SalvadorEnglandEritreaEthiopiaEuropeFijiFranceGermanyGhanaGreeceGrenadaGuatemalaGuyanaHaitiHondurasHong KongHungaryIndiaIndonesiaIranIraqIrelandIsraelItalyJamaicaJapanJordanKazakhstanKenyaKoreaKuwaitLaosLatin AmericaLatviaLebanonLiberiaLithuaniaMalaysiaMexicoMicronesiaMiddle AfricaMoldovaMoroccoNepalNetherlandsNicaraguaNigeriaNorth AmericaNorth MacedoniaNorthern AfricaNorthern EuropeNorwayOceaniaPakistanPanamaPeruPhilippinesPolandPortugalRomaniaRussiaSaudi ArabiaScotlandSenegalSerbiaSierra LeoneSingaporeSomaliaSouth AfricaSouth AmericaSouth Central AsiaSouth Eastern AsiaSouthern EuropeSpainSri LankaSt. Vincent and the GrenadinesSudanSwedenSwitzerlandSyriaTaiwanThailandTrinidad and TobagoTurkeyUgandaUkraineUruguayUzbekistanVenezuelaVietnamWest IndiesWestern AfricaWestern AsiaWestern EuropeYemenZaireZimbabweAzores
Immigrants from Austria
Race
Ancestry
AfghanAfricanAlaska NativeAlaskan AthabascanAlbanianAleutAlsatianAmericanApacheArabArapahoArgentineanArmenianAssyrian/Chaldean/SyriacAustralianAustrianBahamianBangladeshiBarbadianBasqueBelgianBelizeanBermudanBhutaneseBlackfeetBolivianBrazilianBritishBritish West IndianBulgarianBurmeseCajunCambodianCanadianCape VerdeanCarpatho RusynCelticCentral AmericanCentral American IndianCherokeeCheyenneChickasawChileanChineseChippewaChoctawColombianColvilleComancheCosta RicanCreeCreekCroatianCrowCubanCypriotCzechCzechoslovakianDanishDelawareDominicanDutchDutch West IndianEastern EuropeanEcuadorianEgyptianEnglishEstonianEthiopianEuropeanFijianFilipinoFinnishFrenchFrench American IndianFrench CanadianGermanGerman RussianGhanaianGreekGuamanian/ChamorroGuatemalanGuyaneseHaitianHmongHonduranHopiHoumaHungarianIcelanderIndian (Asian)IndonesianInupiatIranianIraqiIrishIroquoisIsraeliItalianJamaicanJapaneseJordanianKenyanKiowaKoreanLaotianLatvianLebaneseLiberianLithuanianLumbeeLuxembourgerMacedonianMalaysianMalteseMarshalleseMenomineeMexicanMexican American IndianMongolianMoroccanNative HawaiianNavajoNepaleseNew ZealanderNicaraguanNigerianNorthern EuropeanNorwegianOkinawanOsageOttawaPaiutePakistaniPalestinianPanamanianParaguayanPennsylvania GermanPeruvianPimaPolishPortuguesePotawatomiPuebloPuerto RicanPuget Sound SalishRomanianRussianSalvadoranSamoanScandinavianScotch-IrishScottishSeminoleSenegaleseSerbianShoshoneSierra LeoneanSiouxSlavicSlovakSloveneSomaliSouth AfricanSouth American IndianSoviet UnionSpaniardSpanishSpanish AmericanSpanish American IndianSri LankanSubsaharan AfricanSudaneseSwedishSwissSyrianTaiwaneseThaiTlingit-HaidaTohono O'OdhamTonganTrinidadian and TobagonianTsimshianTurkishU.S. Virgin IslanderUgandanUkrainianUruguayanUteVenezuelanVietnameseWelshWest IndianYakamaYaquiYugoslavianYumanYup'ikZimbabwean
Immigration
NonimmigrantsImmigrantsAfghanistanAfricaAlbaniaArgentinaArmeniaAsiaAustraliaAustriaBahamasBangladeshBarbadosBelarusBelgiumBelizeBoliviaBosnia and HerzegovinaBrazilBulgariaBurma/MyanmarCabo VerdeCambodiaCameroonCanadaCaribbeanCentral AmericaChileChinaColombiaCongoCosta RicaCroatiaCubaCzechoslovakiaDenmarkDominicaDominican RepublicEastern AfricaEastern AsiaEastern EuropeEcuadorEgyptEl SalvadorEnglandEritreaEthiopiaEuropeFijiFranceGermanyGhanaGreeceGrenadaGuatemalaGuyanaHaitiHondurasHong KongHungaryIndiaIndonesiaIranIraqIrelandIsraelItalyJamaicaJapanJordanKazakhstanKenyaKoreaKuwaitLaosLatin AmericaLatviaLebanonLiberiaLithuaniaMalaysiaMexicoMicronesiaMiddle AfricaMoldovaMoroccoNepalNetherlandsNicaraguaNigeriaNorth AmericaNorth MacedoniaNorthern AfricaNorthern EuropeNorwayOceaniaPakistanPanamaPeruPhilippinesPolandPortugalRomaniaRussiaSaudi ArabiaScotlandSenegalSerbiaSierra LeoneSingaporeSomaliaSouth AfricaSouth AmericaSouth Central AsiaSouth Eastern AsiaSouthern EuropeSpainSri LankaSt. Vincent and the GrenadinesSudanSwedenSwitzerlandSyriaTaiwanThailandTrinidad and TobagoTurkeyUgandaUkraineUruguayUzbekistanVenezuelaVietnamWest IndiesWestern AfricaWestern AsiaWestern EuropeYemenZaireZimbabweAzores
Master's Degree
Income
Poverty
Unemployment
Labor Participation
Family Structure
Vehicle Availability
Education Level
Disability

Master's Degree Comparison

South Americans

Immigrants from Austria

Excellent
Exceptional
15.6%
MASTER'S DEGREE
81.3/ 100
METRIC RATING
145th/ 347
METRIC RANK
18.8%
MASTER'S DEGREE
100.0/ 100
METRIC RATING
47th/ 347
METRIC RANK

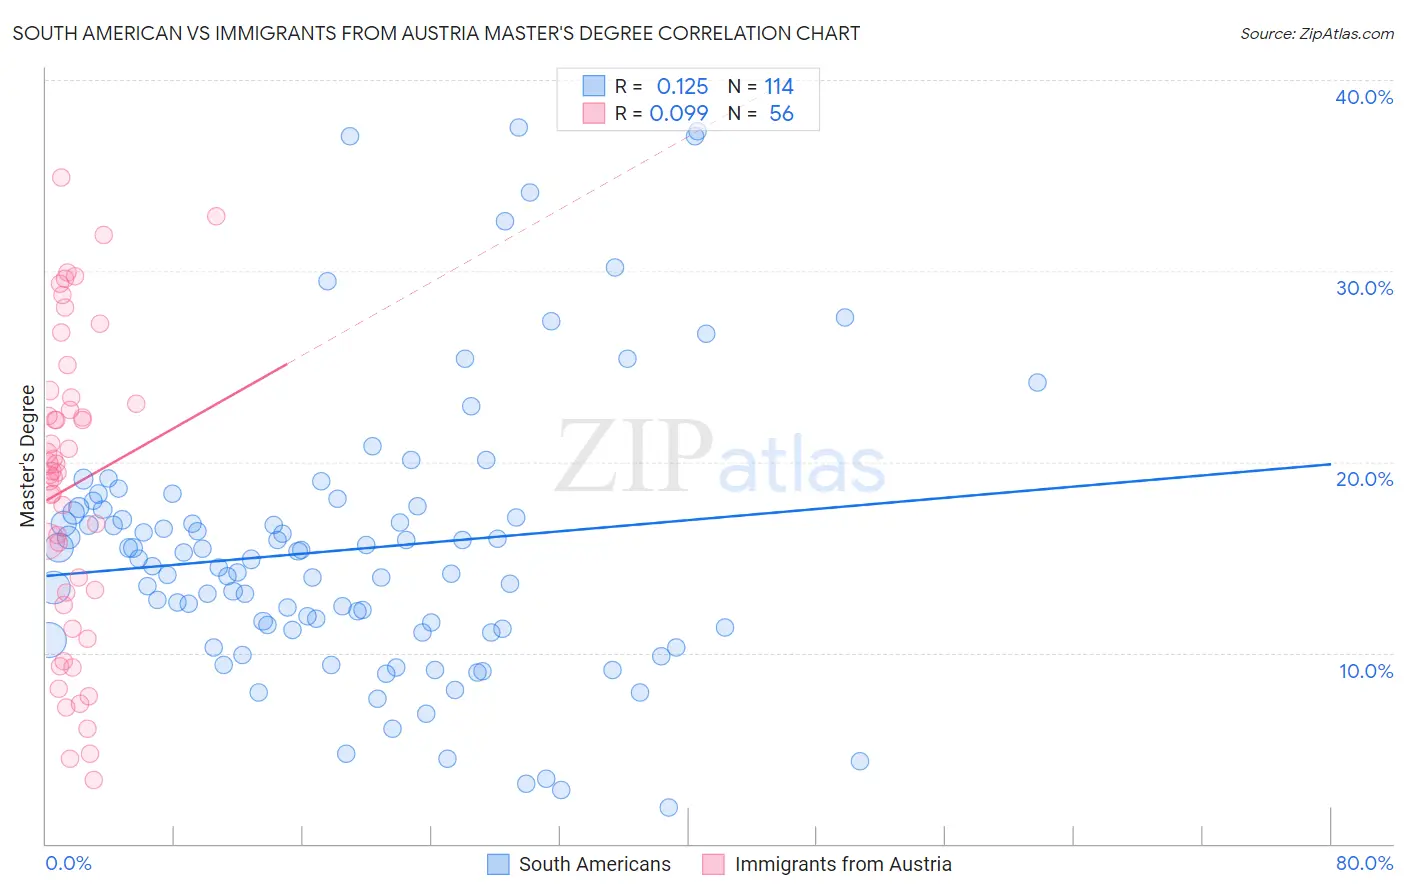
South American vs Immigrants from Austria Master's Degree Correlation Chart

The statistical analysis conducted on geographies consisting of 493,882,123 people shows a poor positive correlation between the proportion of South Americans and percentage of population with at least master's degree education in the United States with a correlation coefficient (R) of 0.125 and weighted average of 15.6%. Similarly, the statistical analysis conducted on geographies consisting of 167,968,334 people shows a slight positive correlation between the proportion of Immigrants from Austria and percentage of population with at least master's degree education in the United States with a correlation coefficient (R) of 0.099 and weighted average of 18.8%, a difference of 20.5%.
South American vs Immigrants from Austria Master's Degree

Master's Degree Correlation Summary

MeasurementSouth AmericanImmigrants from Austria
Minimum1.9%3.4%
Maximum37.5%34.9%
Range35.6%31.5%
Mean15.4%18.7%
Median14.7%19.5%
Interquartile 25% (IQ1)11.2%12.8%
Interquartile 75% (IQ3)17.5%23.2%
Interquartile Range (IQR)6.3%10.4%
Standard Deviation (Sample)7.3%7.9%
Standard Deviation (Population)7.3%7.9%

Similar Demographics by Master's Degree

Demographics Similar to South Americans by Master's Degree

In terms of master's degree, the demographic groups most similar to South Americans are Immigrants from Afghanistan (15.6%, a difference of 0.37%), Hungarian (15.6%, a difference of 0.41%), Canadian (15.7%, a difference of 0.42%), Immigrants from Venezuela (15.7%, a difference of 0.50%), and Immigrants from Senegal (15.5%, a difference of 0.58%).
DemographicsRating | RankMaster's Degree
Pakistanis
86.1
/100
|
#138
Excellent
15.8%
Immigrants | Germany
85.9
/100
|
#139
Excellent
15.8%
Vietnamese
85.5
/100
|
#140
Excellent
15.8%
Poles
85.0
/100
|
#141
Excellent
15.7%
Immigrants | Africa
84.0
/100
|
#142
Excellent
15.7%
Immigrants | Venezuela
83.6
/100
|
#143
Excellent
15.7%
Canadians
83.3
/100
|
#144
Excellent
15.7%
South Americans
81.3
/100
|
#145
Excellent
15.6%
Immigrants | Afghanistan
79.4
/100
|
#146
Good
15.6%
Hungarians
79.1
/100
|
#147
Good
15.6%
Immigrants | Senegal
78.2
/100
|
#148
Good
15.5%
Ghanaians
78.2
/100
|
#149
Good
15.5%
Slovenes
78.0
/100
|
#150
Good
15.5%
Iraqis
77.3
/100
|
#151
Good
15.5%
Slavs
77.0
/100
|
#152
Good
15.5%

Demographics Similar to Immigrants from Austria by Master's Degree

In terms of master's degree, the demographic groups most similar to Immigrants from Austria are Immigrants from Norway (18.8%, a difference of 0.010%), Paraguayan (18.8%, a difference of 0.060%), Estonian (18.8%, a difference of 0.16%), Bulgarian (18.8%, a difference of 0.34%), and Immigrants from South Africa (18.8%, a difference of 0.35%).
DemographicsRating | RankMaster's Degree
Immigrants | Bolivia
100.0
/100
|
#40
Exceptional
19.1%
Immigrants | Latvia
100.0
/100
|
#41
Exceptional
19.1%
Immigrants | Saudi Arabia
100.0
/100
|
#42
Exceptional
19.0%
Immigrants | Greece
100.0
/100
|
#43
Exceptional
19.0%
Immigrants | Malaysia
100.0
/100
|
#44
Exceptional
18.9%
Immigrants | Belarus
100.0
/100
|
#45
Exceptional
18.9%
Immigrants | Norway
100.0
/100
|
#46
Exceptional
18.8%
Immigrants | Austria
100.0
/100
|
#47
Exceptional
18.8%
Paraguayans
100.0
/100
|
#48
Exceptional
18.8%
Estonians
100.0
/100
|
#49
Exceptional
18.8%
Bulgarians
100.0
/100
|
#50
Exceptional
18.8%
Immigrants | South Africa
100.0
/100
|
#51
Exceptional
18.8%
Immigrants | Kuwait
100.0
/100
|
#52
Exceptional
18.6%
Immigrants | Czechoslovakia
99.9
/100
|
#53
Exceptional
18.5%
Immigrants | Lithuania
99.9
/100
|
#54
Exceptional
18.5%