Immigrants from South Central Asia vs Immigrants from Austria Master's Degree
COMPARE
Immigrants from South Central Asia
Immigrants from Austria
Master's Degree
Master's Degree Comparison
Immigrants from South Central Asia
Immigrants from Austria
20.7%
MASTER'S DEGREE
100.0/ 100
METRIC RATING
17th/ 347
METRIC RANK
18.8%
MASTER'S DEGREE
100.0/ 100
METRIC RATING
47th/ 347
METRIC RANK
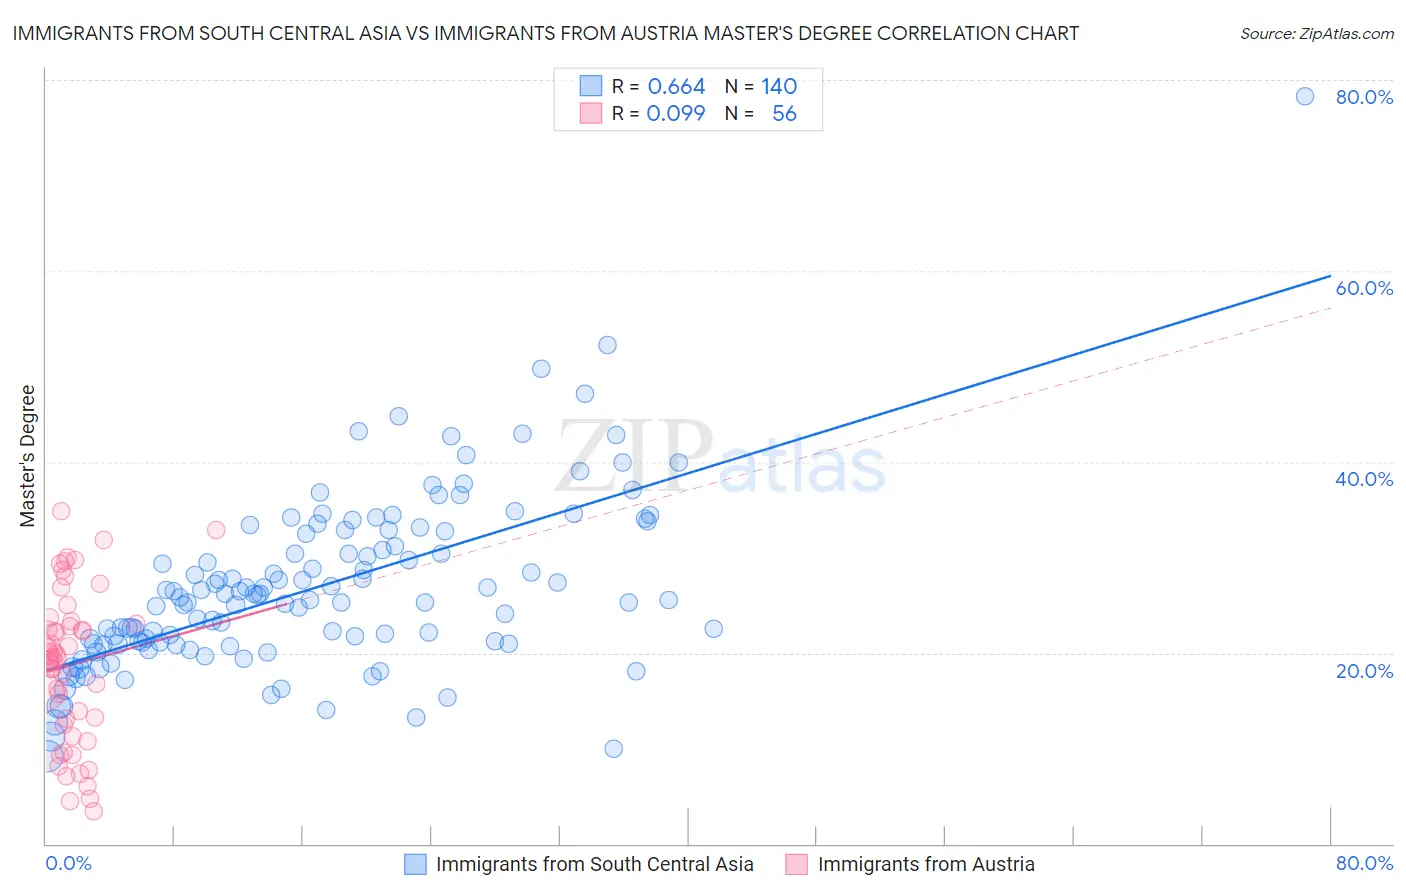
Immigrants from South Central Asia vs Immigrants from Austria Master's Degree Correlation Chart
The statistical analysis conducted on geographies consisting of 472,904,937 people shows a significant positive correlation between the proportion of Immigrants from South Central Asia and percentage of population with at least master's degree education in the United States with a correlation coefficient (R) of 0.664 and weighted average of 20.7%. Similarly, the statistical analysis conducted on geographies consisting of 167,968,334 people shows a slight positive correlation between the proportion of Immigrants from Austria and percentage of population with at least master's degree education in the United States with a correlation coefficient (R) of 0.099 and weighted average of 18.8%, a difference of 10.1%.
Master's Degree Correlation Summary
| Measurement | Immigrants from South Central Asia | Immigrants from Austria |
| Minimum | 9.1% | 3.4% |
| Maximum | 78.4% | 34.9% |
| Range | 69.2% | 31.5% |
| Mean | 26.9% | 18.7% |
| Median | 25.6% | 19.5% |
| Interquartile 25% (IQ1) | 21.0% | 12.8% |
| Interquartile 75% (IQ3) | 32.6% | 23.2% |
| Interquartile Range (IQR) | 11.6% | 10.4% |
| Standard Deviation (Sample) | 9.3% | 7.9% |
| Standard Deviation (Population) | 9.3% | 7.9% |
Similar Demographics by Master's Degree
Demographics Similar to Immigrants from South Central Asia by Master's Degree
In terms of master's degree, the demographic groups most similar to Immigrants from South Central Asia are Immigrants from Belgium (20.8%, a difference of 0.26%), Immigrants from Eastern Asia (20.8%, a difference of 0.54%), Immigrants from Switzerland (20.9%, a difference of 0.73%), Immigrants from Australia (20.9%, a difference of 0.74%), and Soviet Union (20.5%, a difference of 0.92%).
| Demographics | Rating | Rank | Master's Degree |
| Immigrants | Iran | 100.0 /100 | #10 | Exceptional 21.6% |
| Immigrants | China | 100.0 /100 | #11 | Exceptional 21.2% |
| Eastern Europeans | 100.0 /100 | #12 | Exceptional 21.1% |
| Immigrants | Australia | 100.0 /100 | #13 | Exceptional 20.9% |
| Immigrants | Switzerland | 100.0 /100 | #14 | Exceptional 20.9% |
| Immigrants | Eastern Asia | 100.0 /100 | #15 | Exceptional 20.8% |
| Immigrants | Belgium | 100.0 /100 | #16 | Exceptional 20.8% |
| Immigrants | South Central Asia | 100.0 /100 | #17 | Exceptional 20.7% |
| Soviet Union | 100.0 /100 | #18 | Exceptional 20.5% |
| Immigrants | Hong Kong | 100.0 /100 | #19 | Exceptional 20.5% |
| Indians (Asian) | 100.0 /100 | #20 | Exceptional 20.5% |
| Immigrants | Ireland | 100.0 /100 | #21 | Exceptional 20.4% |
| Israelis | 100.0 /100 | #22 | Exceptional 20.3% |
| Immigrants | France | 100.0 /100 | #23 | Exceptional 20.3% |
| Immigrants | Sweden | 100.0 /100 | #24 | Exceptional 20.3% |
Demographics Similar to Immigrants from Austria by Master's Degree
In terms of master's degree, the demographic groups most similar to Immigrants from Austria are Immigrants from Norway (18.8%, a difference of 0.010%), Paraguayan (18.8%, a difference of 0.060%), Estonian (18.8%, a difference of 0.16%), Bulgarian (18.8%, a difference of 0.34%), and Immigrants from South Africa (18.8%, a difference of 0.35%).
| Demographics | Rating | Rank | Master's Degree |
| Immigrants | Bolivia | 100.0 /100 | #40 | Exceptional 19.1% |
| Immigrants | Latvia | 100.0 /100 | #41 | Exceptional 19.1% |
| Immigrants | Saudi Arabia | 100.0 /100 | #42 | Exceptional 19.0% |
| Immigrants | Greece | 100.0 /100 | #43 | Exceptional 19.0% |
| Immigrants | Malaysia | 100.0 /100 | #44 | Exceptional 18.9% |
| Immigrants | Belarus | 100.0 /100 | #45 | Exceptional 18.9% |
| Immigrants | Norway | 100.0 /100 | #46 | Exceptional 18.8% |
| Immigrants | Austria | 100.0 /100 | #47 | Exceptional 18.8% |
| Paraguayans | 100.0 /100 | #48 | Exceptional 18.8% |
| Estonians | 100.0 /100 | #49 | Exceptional 18.8% |
| Bulgarians | 100.0 /100 | #50 | Exceptional 18.8% |
| Immigrants | South Africa | 100.0 /100 | #51 | Exceptional 18.8% |
| Immigrants | Kuwait | 100.0 /100 | #52 | Exceptional 18.6% |
| Immigrants | Czechoslovakia | 99.9 /100 | #53 | Exceptional 18.5% |
| Immigrants | Lithuania | 99.9 /100 | #54 | Exceptional 18.5% |