Fijian vs Immigrants from Armenia 11th Grade
COMPARE
Fijian
Immigrants from Armenia
11th Grade
11th Grade Comparison
Fijians
Immigrants from Armenia
90.0%
11TH GRADE
0.0/ 100
METRIC RATING
296th/ 347
METRIC RANK
88.8%
11TH GRADE
0.0/ 100
METRIC RATING
320th/ 347
METRIC RANK
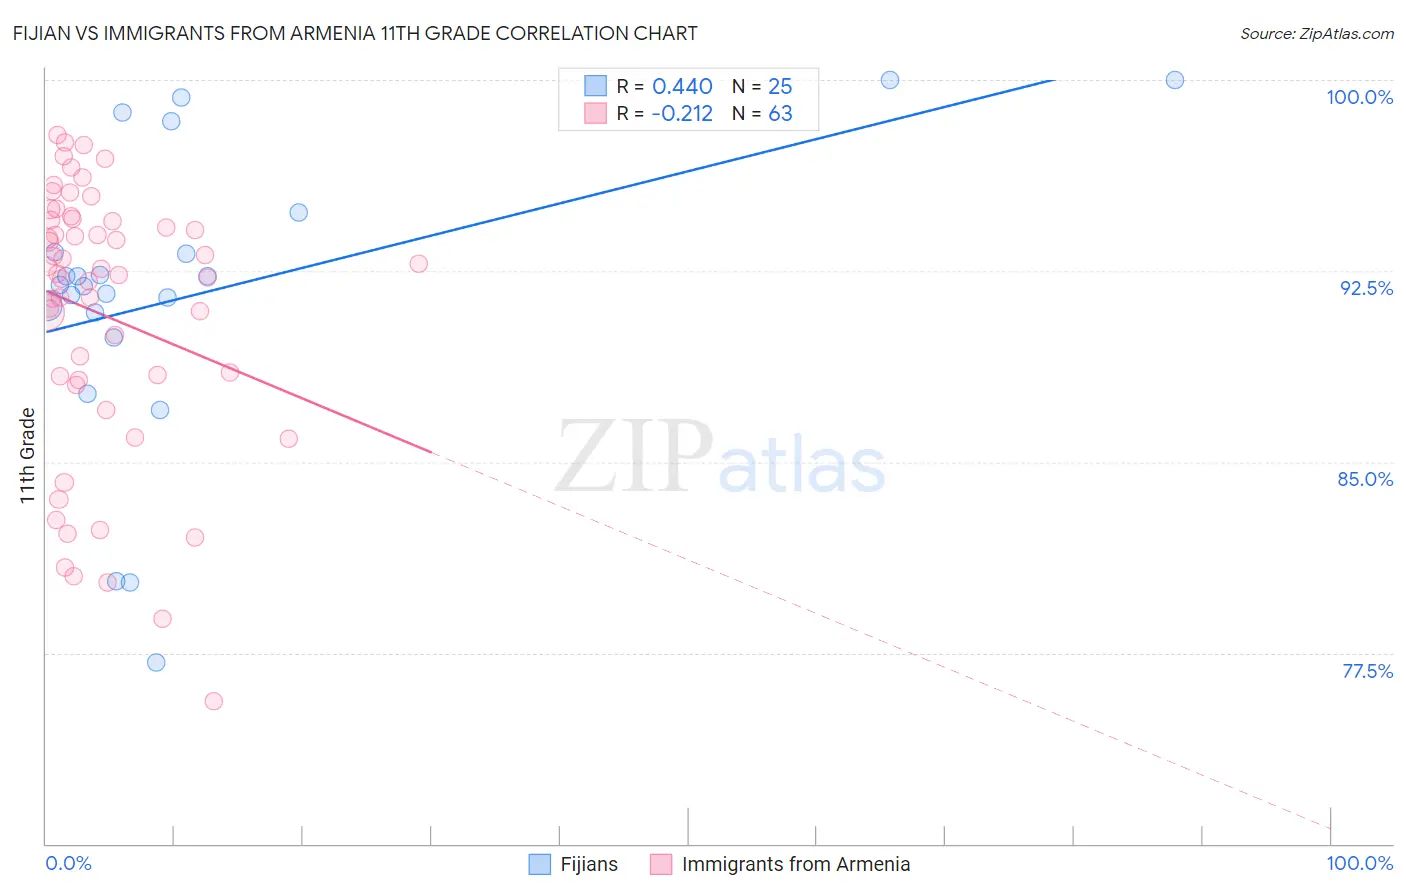
Fijian vs Immigrants from Armenia 11th Grade Correlation Chart
The statistical analysis conducted on geographies consisting of 55,948,842 people shows a moderate positive correlation between the proportion of Fijians and percentage of population with at least 11th grade education in the United States with a correlation coefficient (R) of 0.440 and weighted average of 90.0%. Similarly, the statistical analysis conducted on geographies consisting of 97,657,339 people shows a weak negative correlation between the proportion of Immigrants from Armenia and percentage of population with at least 11th grade education in the United States with a correlation coefficient (R) of -0.212 and weighted average of 88.8%, a difference of 1.4%.
11th Grade Correlation Summary
| Measurement | Fijian | Immigrants from Armenia |
| Minimum | 77.1% | 75.6% |
| Maximum | 100.0% | 97.8% |
| Range | 22.9% | 22.2% |
| Mean | 91.6% | 90.8% |
| Median | 92.0% | 92.4% |
| Interquartile 25% (IQ1) | 90.4% | 88.2% |
| Interquartile 75% (IQ3) | 94.0% | 94.5% |
| Interquartile Range (IQR) | 3.6% | 6.3% |
| Standard Deviation (Sample) | 5.8% | 5.3% |
| Standard Deviation (Population) | 5.7% | 5.3% |
Similar Demographics by 11th Grade
Demographics Similar to Fijians by 11th Grade
In terms of 11th grade, the demographic groups most similar to Fijians are Immigrants from Vietnam (90.0%, a difference of 0.020%), Navajo (90.0%, a difference of 0.040%), Immigrants from Fiji (89.9%, a difference of 0.11%), Immigrants from Grenada (90.1%, a difference of 0.12%), and Japanese (89.9%, a difference of 0.14%).
| Demographics | Rating | Rank | 11th Grade |
| British West Indians | 0.0 /100 | #289 | Tragic 90.3% |
| Indonesians | 0.0 /100 | #290 | Tragic 90.3% |
| Haitians | 0.0 /100 | #291 | Tragic 90.3% |
| Cubans | 0.0 /100 | #292 | Tragic 90.2% |
| Natives/Alaskans | 0.0 /100 | #293 | Tragic 90.2% |
| Immigrants | Grenada | 0.0 /100 | #294 | Tragic 90.1% |
| Immigrants | Vietnam | 0.0 /100 | #295 | Tragic 90.0% |
| Fijians | 0.0 /100 | #296 | Tragic 90.0% |
| Navajo | 0.0 /100 | #297 | Tragic 90.0% |
| Immigrants | Fiji | 0.0 /100 | #298 | Tragic 89.9% |
| Japanese | 0.0 /100 | #299 | Tragic 89.9% |
| Immigrants | Haiti | 0.0 /100 | #300 | Tragic 89.9% |
| Guyanese | 0.0 /100 | #301 | Tragic 89.9% |
| Immigrants | Guyana | 0.0 /100 | #302 | Tragic 89.7% |
| Immigrants | Immigrants | 0.0 /100 | #303 | Tragic 89.7% |
Demographics Similar to Immigrants from Armenia by 11th Grade
In terms of 11th grade, the demographic groups most similar to Immigrants from Armenia are Belizean (88.8%, a difference of 0.020%), Immigrants from Belize (88.7%, a difference of 0.090%), Nicaraguan (88.9%, a difference of 0.11%), Lumbee (88.9%, a difference of 0.17%), and Immigrants from Cuba (88.9%, a difference of 0.18%).
| Demographics | Rating | Rank | 11th Grade |
| Immigrants | Caribbean | 0.0 /100 | #313 | Tragic 89.1% |
| Cape Verdeans | 0.0 /100 | #314 | Tragic 89.1% |
| Immigrants | Ecuador | 0.0 /100 | #315 | Tragic 89.1% |
| Immigrants | Cuba | 0.0 /100 | #316 | Tragic 88.9% |
| Lumbee | 0.0 /100 | #317 | Tragic 88.9% |
| Nicaraguans | 0.0 /100 | #318 | Tragic 88.9% |
| Belizeans | 0.0 /100 | #319 | Tragic 88.8% |
| Immigrants | Armenia | 0.0 /100 | #320 | Tragic 88.8% |
| Immigrants | Belize | 0.0 /100 | #321 | Tragic 88.7% |
| Puerto Ricans | 0.0 /100 | #322 | Tragic 88.4% |
| Pima | 0.0 /100 | #323 | Tragic 88.3% |
| Central American Indians | 0.0 /100 | #324 | Tragic 88.2% |
| Immigrants | Nicaragua | 0.0 /100 | #325 | Tragic 88.1% |
| Dominicans | 0.0 /100 | #326 | Tragic 87.7% |
| Immigrants | Cabo Verde | 0.0 /100 | #327 | Tragic 87.6% |