Immigrants from Korea vs Navajo 4th Grade
COMPARE
Immigrants from Korea
Navajo
4th Grade
4th Grade Comparison
Immigrants from Korea
Navajo
97.5%
4TH GRADE
50.6/ 100
METRIC RATING
173rd/ 347
METRIC RANK
97.4%
4TH GRADE
30.7/ 100
METRIC RATING
191st/ 347
METRIC RANK
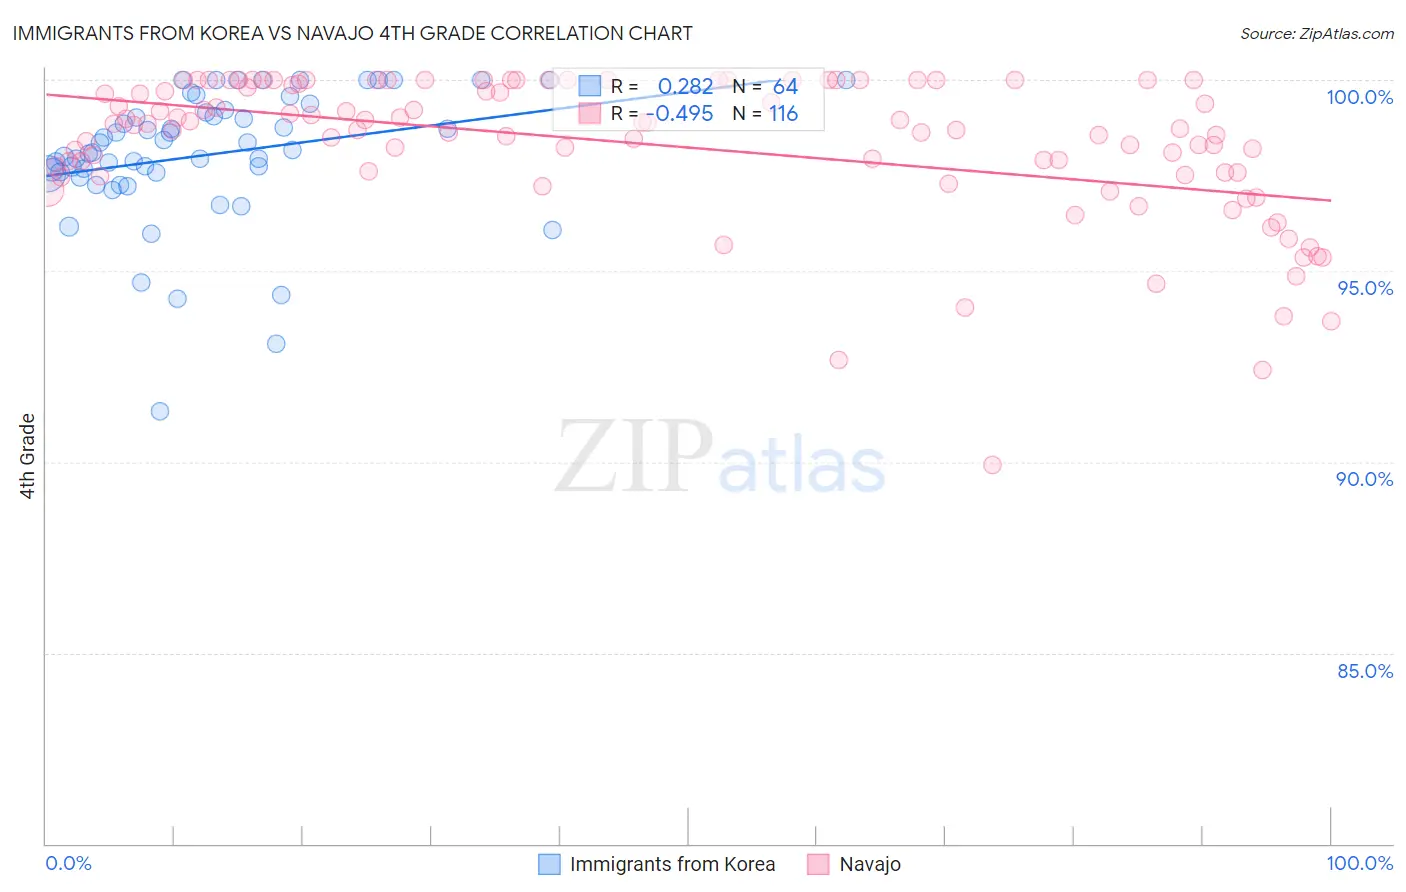
Immigrants from Korea vs Navajo 4th Grade Correlation Chart
The statistical analysis conducted on geographies consisting of 416,280,076 people shows a weak positive correlation between the proportion of Immigrants from Korea and percentage of population with at least 4th grade education in the United States with a correlation coefficient (R) of 0.282 and weighted average of 97.5%. Similarly, the statistical analysis conducted on geographies consisting of 224,872,987 people shows a moderate negative correlation between the proportion of Navajo and percentage of population with at least 4th grade education in the United States with a correlation coefficient (R) of -0.495 and weighted average of 97.4%, a difference of 0.080%.
4th Grade Correlation Summary
| Measurement | Immigrants from Korea | Navajo |
| Minimum | 91.3% | 89.9% |
| Maximum | 100.0% | 100.0% |
| Range | 8.7% | 10.1% |
| Mean | 98.0% | 98.3% |
| Median | 98.1% | 98.8% |
| Interquartile 25% (IQ1) | 97.6% | 97.6% |
| Interquartile 75% (IQ3) | 99.2% | 99.9% |
| Interquartile Range (IQR) | 1.6% | 2.4% |
| Standard Deviation (Sample) | 1.7% | 1.9% |
| Standard Deviation (Population) | 1.7% | 1.9% |
Demographics Similar to Immigrants from Korea and Navajo by 4th Grade
In terms of 4th grade, the demographic groups most similar to Immigrants from Korea are Immigrants from Sri Lanka (97.5%, a difference of 0.0%), Egyptian (97.5%, a difference of 0.0%), Immigrants from Micronesia (97.5%, a difference of 0.0%), Arab (97.5%, a difference of 0.010%), and Immigrants from Brazil (97.5%, a difference of 0.020%). Similarly, the demographic groups most similar to Navajo are Black/African American (97.4%, a difference of 0.0%), Immigrants from Ukraine (97.4%, a difference of 0.0%), Panamanian (97.4%, a difference of 0.010%), Pakistani (97.5%, a difference of 0.020%), and Immigrants from Kenya (97.5%, a difference of 0.020%).
| Demographics | Rating | Rank | 4th Grade |
| Immigrants | Sri Lanka | 51.1 /100 | #172 | Average 97.5% |
| Immigrants | Korea | 50.6 /100 | #173 | Average 97.5% |
| Egyptians | 50.0 /100 | #174 | Average 97.5% |
| Immigrants | Micronesia | 49.6 /100 | #175 | Average 97.5% |
| Arabs | 48.7 /100 | #176 | Average 97.5% |
| Immigrants | Brazil | 46.1 /100 | #177 | Average 97.5% |
| Comanche | 45.3 /100 | #178 | Average 97.5% |
| Immigrants | Kazakhstan | 43.6 /100 | #179 | Average 97.5% |
| Immigrants | Venezuela | 42.7 /100 | #180 | Average 97.5% |
| Immigrants | Taiwan | 41.5 /100 | #181 | Average 97.5% |
| Spanish Americans | 39.3 /100 | #182 | Fair 97.5% |
| Argentineans | 39.0 /100 | #183 | Fair 97.5% |
| Pakistanis | 36.2 /100 | #184 | Fair 97.5% |
| Immigrants | Kenya | 35.8 /100 | #185 | Fair 97.5% |
| Dutch West Indians | 35.8 /100 | #186 | Fair 97.5% |
| Mongolians | 34.7 /100 | #187 | Fair 97.5% |
| Immigrants | Argentina | 34.6 /100 | #188 | Fair 97.5% |
| Panamanians | 31.9 /100 | #189 | Fair 97.4% |
| Blacks/African Americans | 31.1 /100 | #190 | Fair 97.4% |
| Navajo | 30.7 /100 | #191 | Fair 97.4% |
| Immigrants | Ukraine | 30.1 /100 | #192 | Fair 97.4% |