Cuban vs Navajo 4th Grade
COMPARE
Cuban
Navajo
4th Grade
4th Grade Comparison
Cubans
Navajo
96.9%
4TH GRADE
0.2/ 100
METRIC RATING
270th/ 347
METRIC RANK
97.4%
4TH GRADE
30.7/ 100
METRIC RATING
191st/ 347
METRIC RANK
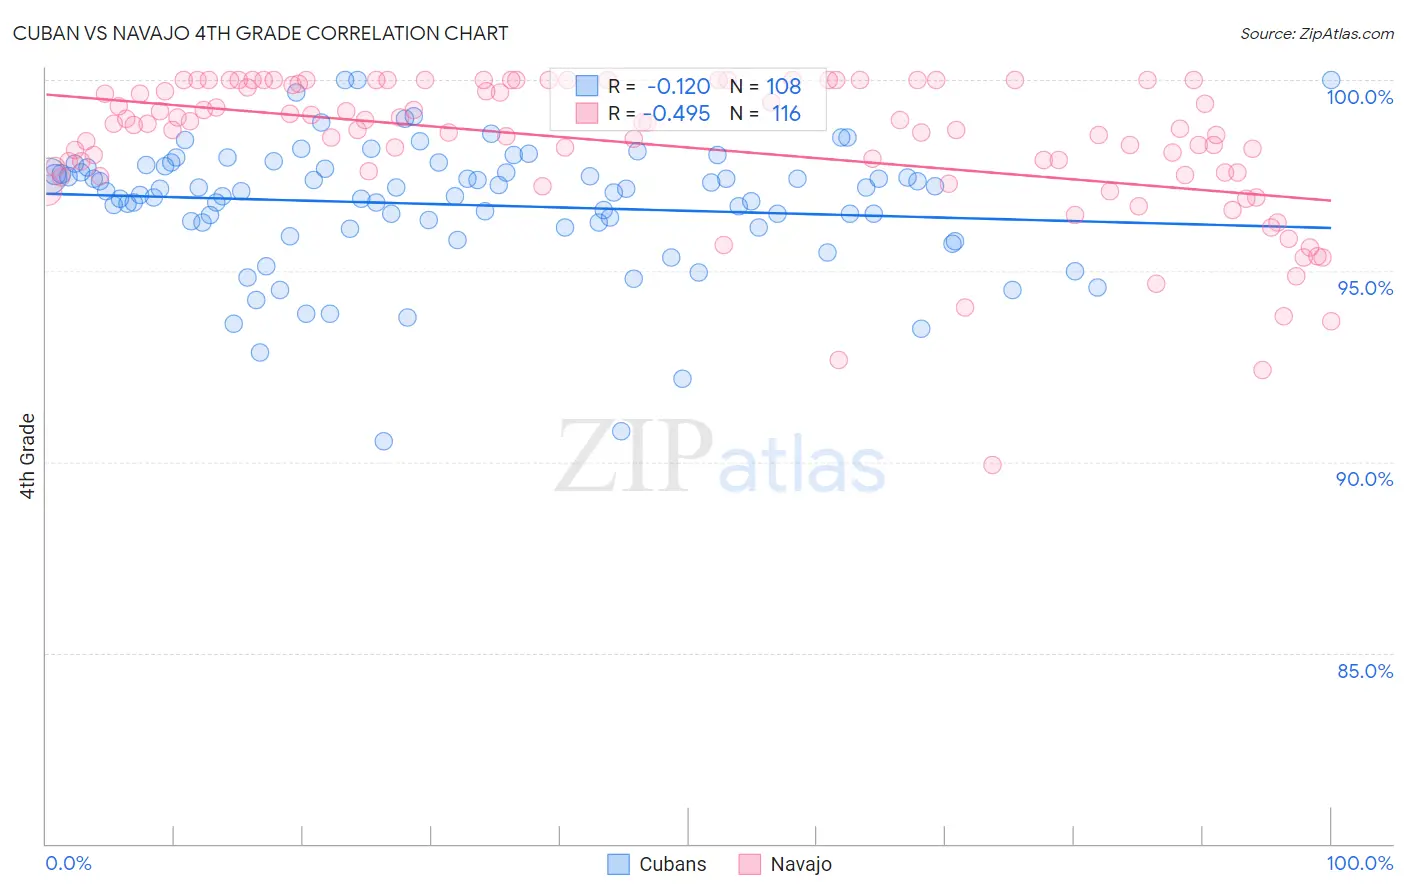
Cuban vs Navajo 4th Grade Correlation Chart
The statistical analysis conducted on geographies consisting of 449,326,865 people shows a poor negative correlation between the proportion of Cubans and percentage of population with at least 4th grade education in the United States with a correlation coefficient (R) of -0.120 and weighted average of 96.9%. Similarly, the statistical analysis conducted on geographies consisting of 224,872,987 people shows a moderate negative correlation between the proportion of Navajo and percentage of population with at least 4th grade education in the United States with a correlation coefficient (R) of -0.495 and weighted average of 97.4%, a difference of 0.54%.
4th Grade Correlation Summary
| Measurement | Cuban | Navajo |
| Minimum | 90.5% | 89.9% |
| Maximum | 100.0% | 100.0% |
| Range | 9.5% | 10.1% |
| Mean | 96.7% | 98.3% |
| Median | 97.1% | 98.8% |
| Interquartile 25% (IQ1) | 96.2% | 97.6% |
| Interquartile 75% (IQ3) | 97.7% | 99.9% |
| Interquartile Range (IQR) | 1.5% | 2.4% |
| Standard Deviation (Sample) | 1.7% | 1.9% |
| Standard Deviation (Population) | 1.7% | 1.9% |
Similar Demographics by 4th Grade
Demographics Similar to Cubans by 4th Grade
In terms of 4th grade, the demographic groups most similar to Cubans are Immigrants from Peru (96.9%, a difference of 0.010%), Fijian (96.9%, a difference of 0.010%), Immigrants from Uzbekistan (96.9%, a difference of 0.020%), Immigrants from Cameroon (96.9%, a difference of 0.020%), and Trinidadian and Tobagonian (96.9%, a difference of 0.030%).
| Demographics | Rating | Rank | 4th Grade |
| Immigrants | Jamaica | 0.3 /100 | #263 | Tragic 97.0% |
| Taiwanese | 0.3 /100 | #264 | Tragic 97.0% |
| Armenians | 0.3 /100 | #265 | Tragic 97.0% |
| Immigrants | China | 0.3 /100 | #266 | Tragic 97.0% |
| Immigrants | Nigeria | 0.3 /100 | #267 | Tragic 97.0% |
| Ghanaians | 0.2 /100 | #268 | Tragic 97.0% |
| Immigrants | Uzbekistan | 0.2 /100 | #269 | Tragic 96.9% |
| Cubans | 0.2 /100 | #270 | Tragic 96.9% |
| Immigrants | Peru | 0.1 /100 | #271 | Tragic 96.9% |
| Fijians | 0.1 /100 | #272 | Tragic 96.9% |
| Immigrants | Cameroon | 0.1 /100 | #273 | Tragic 96.9% |
| Trinidadians and Tobagonians | 0.1 /100 | #274 | Tragic 96.9% |
| Immigrants | Ghana | 0.1 /100 | #275 | Tragic 96.9% |
| Yaqui | 0.1 /100 | #276 | Tragic 96.9% |
| Immigrants | Western Africa | 0.1 /100 | #277 | Tragic 96.9% |
Demographics Similar to Navajo by 4th Grade
In terms of 4th grade, the demographic groups most similar to Navajo are Black/African American (97.4%, a difference of 0.0%), Immigrants from Ukraine (97.4%, a difference of 0.0%), Immigrants from Egypt (97.4%, a difference of 0.0%), Panamanian (97.4%, a difference of 0.010%), and Portuguese (97.4%, a difference of 0.010%).
| Demographics | Rating | Rank | 4th Grade |
| Pakistanis | 36.2 /100 | #184 | Fair 97.5% |
| Immigrants | Kenya | 35.8 /100 | #185 | Fair 97.5% |
| Dutch West Indians | 35.8 /100 | #186 | Fair 97.5% |
| Mongolians | 34.7 /100 | #187 | Fair 97.5% |
| Immigrants | Argentina | 34.6 /100 | #188 | Fair 97.5% |
| Panamanians | 31.9 /100 | #189 | Fair 97.4% |
| Blacks/African Americans | 31.1 /100 | #190 | Fair 97.4% |
| Navajo | 30.7 /100 | #191 | Fair 97.4% |
| Immigrants | Ukraine | 30.1 /100 | #192 | Fair 97.4% |
| Immigrants | Egypt | 30.1 /100 | #193 | Fair 97.4% |
| Portuguese | 29.2 /100 | #194 | Fair 97.4% |
| Paraguayans | 28.9 /100 | #195 | Fair 97.4% |
| Immigrants | Albania | 27.7 /100 | #196 | Fair 97.4% |
| Hawaiians | 25.6 /100 | #197 | Fair 97.4% |
| Guamanians/Chamorros | 23.0 /100 | #198 | Fair 97.4% |