Central American Indian vs Navajo 4th Grade
COMPARE
Central American Indian
Navajo
4th Grade
4th Grade Comparison
Central American Indians
Navajo
96.2%
4TH GRADE
0.0/ 100
METRIC RATING
317th/ 347
METRIC RANK
97.4%
4TH GRADE
30.7/ 100
METRIC RATING
191st/ 347
METRIC RANK
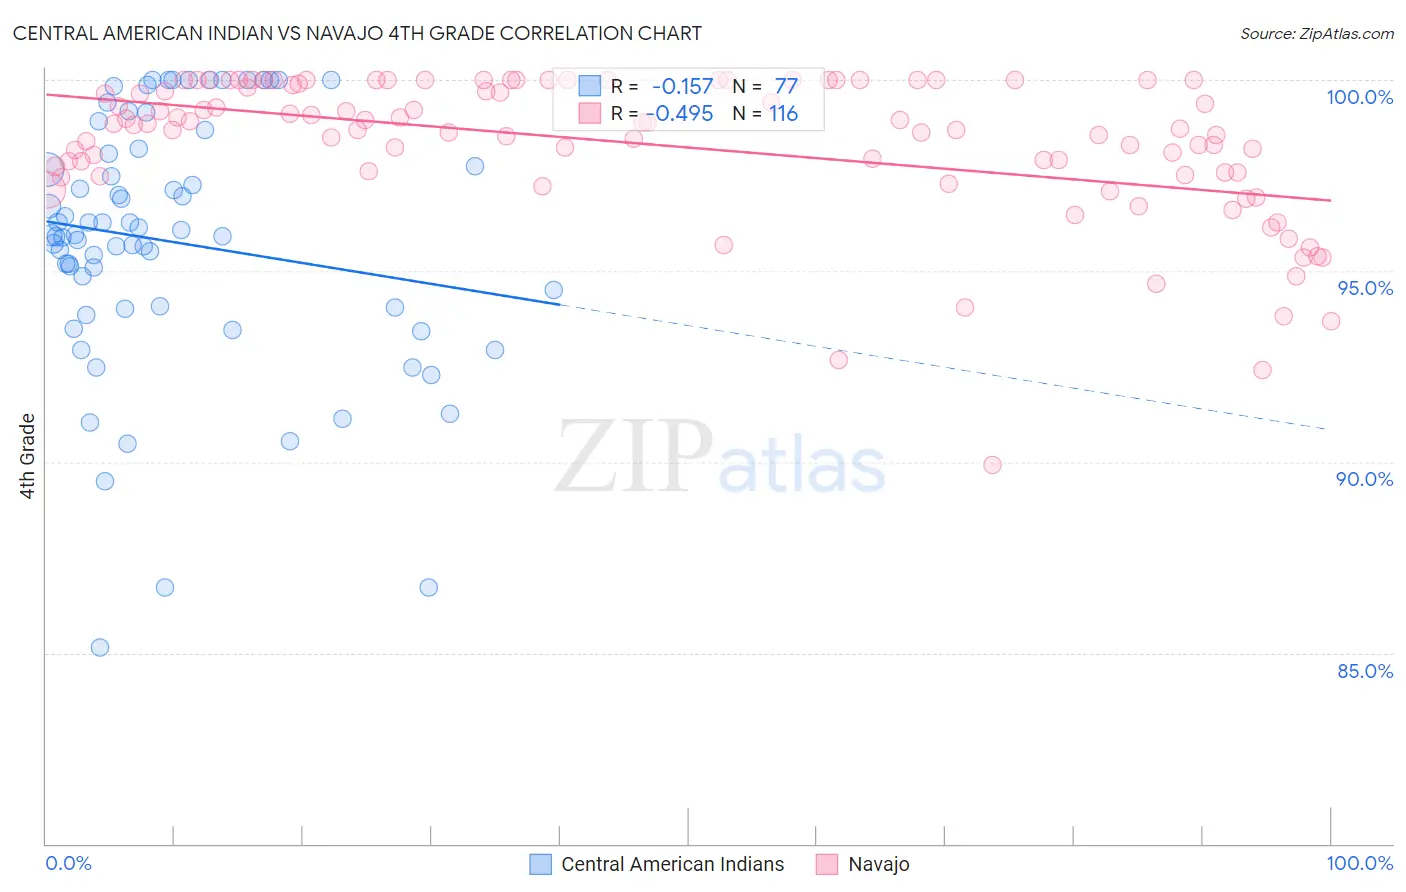
Central American Indian vs Navajo 4th Grade Correlation Chart
The statistical analysis conducted on geographies consisting of 326,140,921 people shows a poor negative correlation between the proportion of Central American Indians and percentage of population with at least 4th grade education in the United States with a correlation coefficient (R) of -0.157 and weighted average of 96.2%. Similarly, the statistical analysis conducted on geographies consisting of 224,872,987 people shows a moderate negative correlation between the proportion of Navajo and percentage of population with at least 4th grade education in the United States with a correlation coefficient (R) of -0.495 and weighted average of 97.4%, a difference of 1.3%.
4th Grade Correlation Summary
| Measurement | Central American Indian | Navajo |
| Minimum | 85.1% | 89.9% |
| Maximum | 100.0% | 100.0% |
| Range | 14.9% | 10.1% |
| Mean | 95.8% | 98.3% |
| Median | 95.9% | 98.8% |
| Interquartile 25% (IQ1) | 94.0% | 97.6% |
| Interquartile 75% (IQ3) | 98.1% | 99.9% |
| Interquartile Range (IQR) | 4.1% | 2.4% |
| Standard Deviation (Sample) | 3.3% | 1.9% |
| Standard Deviation (Population) | 3.3% | 1.9% |
Similar Demographics by 4th Grade
Demographics Similar to Central American Indians by 4th Grade
In terms of 4th grade, the demographic groups most similar to Central American Indians are Immigrants from Ecuador (96.2%, a difference of 0.040%), Immigrants from the Azores (96.1%, a difference of 0.040%), Vietnamese (96.2%, a difference of 0.050%), Nicaraguan (96.2%, a difference of 0.050%), and Indonesian (96.2%, a difference of 0.060%).
| Demographics | Rating | Rank | 4th Grade |
| Immigrants | Burma/Myanmar | 0.0 /100 | #310 | Tragic 96.3% |
| Immigrants | Bangladesh | 0.0 /100 | #311 | Tragic 96.2% |
| Cape Verdeans | 0.0 /100 | #312 | Tragic 96.2% |
| Indonesians | 0.0 /100 | #313 | Tragic 96.2% |
| Vietnamese | 0.0 /100 | #314 | Tragic 96.2% |
| Nicaraguans | 0.0 /100 | #315 | Tragic 96.2% |
| Immigrants | Ecuador | 0.0 /100 | #316 | Tragic 96.2% |
| Central American Indians | 0.0 /100 | #317 | Tragic 96.2% |
| Immigrants | Azores | 0.0 /100 | #318 | Tragic 96.1% |
| Belizeans | 0.0 /100 | #319 | Tragic 96.1% |
| Bangladeshis | 0.0 /100 | #320 | Tragic 96.1% |
| Japanese | 0.0 /100 | #321 | Tragic 96.0% |
| Immigrants | Vietnam | 0.0 /100 | #322 | Tragic 96.0% |
| Immigrants | Nicaragua | 0.0 /100 | #323 | Tragic 96.0% |
| Immigrants | Belize | 0.0 /100 | #324 | Tragic 96.0% |
Demographics Similar to Navajo by 4th Grade
In terms of 4th grade, the demographic groups most similar to Navajo are Black/African American (97.4%, a difference of 0.0%), Immigrants from Ukraine (97.4%, a difference of 0.0%), Immigrants from Egypt (97.4%, a difference of 0.0%), Panamanian (97.4%, a difference of 0.010%), and Portuguese (97.4%, a difference of 0.010%).
| Demographics | Rating | Rank | 4th Grade |
| Pakistanis | 36.2 /100 | #184 | Fair 97.5% |
| Immigrants | Kenya | 35.8 /100 | #185 | Fair 97.5% |
| Dutch West Indians | 35.8 /100 | #186 | Fair 97.5% |
| Mongolians | 34.7 /100 | #187 | Fair 97.5% |
| Immigrants | Argentina | 34.6 /100 | #188 | Fair 97.5% |
| Panamanians | 31.9 /100 | #189 | Fair 97.4% |
| Blacks/African Americans | 31.1 /100 | #190 | Fair 97.4% |
| Navajo | 30.7 /100 | #191 | Fair 97.4% |
| Immigrants | Ukraine | 30.1 /100 | #192 | Fair 97.4% |
| Immigrants | Egypt | 30.1 /100 | #193 | Fair 97.4% |
| Portuguese | 29.2 /100 | #194 | Fair 97.4% |
| Paraguayans | 28.9 /100 | #195 | Fair 97.4% |
| Immigrants | Albania | 27.7 /100 | #196 | Fair 97.4% |
| Hawaiians | 25.6 /100 | #197 | Fair 97.4% |
| Guamanians/Chamorros | 23.0 /100 | #198 | Fair 97.4% |