Ethiopian vs Spanish American Indian College, Under 1 year
COMPARE
Ethiopian
Spanish American Indian
College, Under 1 year
College, Under 1 year Comparison
Ethiopians
Spanish American Indians
68.3%
COLLEGE, UNDER 1 YEAR
98.2/ 100
METRIC RATING
89th/ 347
METRIC RANK
54.0%
COLLEGE, UNDER 1 YEAR
0.0/ 100
METRIC RATING
340th/ 347
METRIC RANK
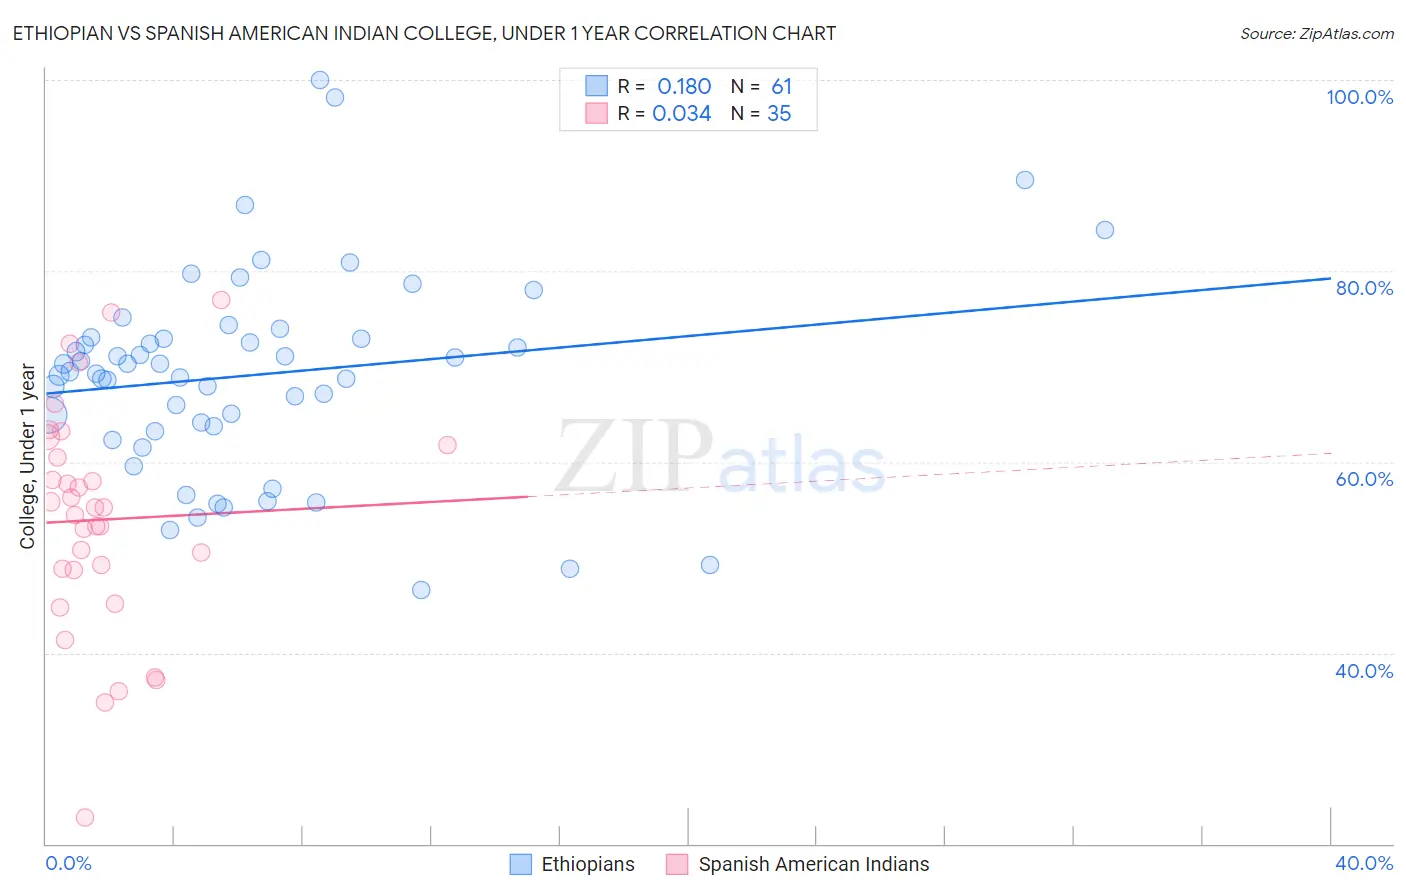
Ethiopian vs Spanish American Indian College, Under 1 year Correlation Chart
The statistical analysis conducted on geographies consisting of 223,260,030 people shows a poor positive correlation between the proportion of Ethiopians and percentage of population with at least college, under 1 year education in the United States with a correlation coefficient (R) of 0.180 and weighted average of 68.3%. Similarly, the statistical analysis conducted on geographies consisting of 73,150,359 people shows no correlation between the proportion of Spanish American Indians and percentage of population with at least college, under 1 year education in the United States with a correlation coefficient (R) of 0.034 and weighted average of 54.0%, a difference of 26.6%.
College, Under 1 year Correlation Summary
| Measurement | Ethiopian | Spanish American Indian |
| Minimum | 46.6% | 22.8% |
| Maximum | 100.0% | 77.0% |
| Range | 53.4% | 54.2% |
| Mean | 69.1% | 53.9% |
| Median | 69.4% | 55.2% |
| Interquartile 25% (IQ1) | 63.5% | 48.7% |
| Interquartile 75% (IQ3) | 73.0% | 61.8% |
| Interquartile Range (IQR) | 9.5% | 13.1% |
| Standard Deviation (Sample) | 10.6% | 11.9% |
| Standard Deviation (Population) | 10.6% | 11.7% |
Similar Demographics by College, Under 1 year
Demographics Similar to Ethiopians by College, Under 1 year
In terms of college, under 1 year, the demographic groups most similar to Ethiopians are Croatian (68.3%, a difference of 0.010%), Chinese (68.3%, a difference of 0.030%), Immigrants from Lebanon (68.3%, a difference of 0.050%), Immigrants from Hungary (68.3%, a difference of 0.060%), and Egyptian (68.3%, a difference of 0.060%).
| Demographics | Rating | Rank | College, Under 1 year |
| Norwegians | 98.4 /100 | #82 | Exceptional 68.4% |
| Argentineans | 98.4 /100 | #83 | Exceptional 68.4% |
| Immigrants | Hungary | 98.3 /100 | #84 | Exceptional 68.3% |
| Egyptians | 98.3 /100 | #85 | Exceptional 68.3% |
| Immigrants | Lebanon | 98.3 /100 | #86 | Exceptional 68.3% |
| Chinese | 98.3 /100 | #87 | Exceptional 68.3% |
| Croatians | 98.2 /100 | #88 | Exceptional 68.3% |
| Ethiopians | 98.2 /100 | #89 | Exceptional 68.3% |
| Icelanders | 98.1 /100 | #90 | Exceptional 68.3% |
| Europeans | 98.1 /100 | #91 | Exceptional 68.2% |
| Luxembourgers | 98.1 /100 | #92 | Exceptional 68.2% |
| Romanians | 97.9 /100 | #93 | Exceptional 68.2% |
| Armenians | 97.7 /100 | #94 | Exceptional 68.1% |
| Immigrants | Pakistan | 97.5 /100 | #95 | Exceptional 68.0% |
| Jordanians | 97.4 /100 | #96 | Exceptional 68.0% |
Demographics Similar to Spanish American Indians by College, Under 1 year
In terms of college, under 1 year, the demographic groups most similar to Spanish American Indians are Immigrants from Dominican Republic (54.0%, a difference of 0.090%), Lumbee (54.2%, a difference of 0.49%), Immigrants from Cabo Verde (53.7%, a difference of 0.51%), Immigrants from Mexico (53.7%, a difference of 0.57%), and Immigrants from Central America (54.4%, a difference of 0.90%).
| Demographics | Rating | Rank | College, Under 1 year |
| Yuman | 0.0 /100 | #333 | Tragic 55.1% |
| Immigrants | Azores | 0.0 /100 | #334 | Tragic 54.7% |
| Inupiat | 0.0 /100 | #335 | Tragic 54.6% |
| Pennsylvania Germans | 0.0 /100 | #336 | Tragic 54.5% |
| Immigrants | Central America | 0.0 /100 | #337 | Tragic 54.4% |
| Lumbee | 0.0 /100 | #338 | Tragic 54.2% |
| Immigrants | Dominican Republic | 0.0 /100 | #339 | Tragic 54.0% |
| Spanish American Indians | 0.0 /100 | #340 | Tragic 54.0% |
| Immigrants | Cabo Verde | 0.0 /100 | #341 | Tragic 53.7% |
| Immigrants | Mexico | 0.0 /100 | #342 | Tragic 53.7% |
| Tohono O'odham | 0.0 /100 | #343 | Tragic 52.8% |
| Yakama | 0.0 /100 | #344 | Tragic 52.6% |
| Pima | 0.0 /100 | #345 | Tragic 51.4% |
| Houma | 0.0 /100 | #346 | Tragic 47.6% |
| Yup'ik | 0.0 /100 | #347 | Tragic 45.8% |