Ethiopian vs U.S. Virgin Islander 10th Grade
COMPARE
Ethiopian
U.S. Virgin Islander
10th Grade
10th Grade Comparison
Ethiopians
U.S. Virgin Islanders
93.2%
10TH GRADE
7.9/ 100
METRIC RATING
222nd/ 347
METRIC RANK
92.7%
10TH GRADE
0.7/ 100
METRIC RATING
257th/ 347
METRIC RANK
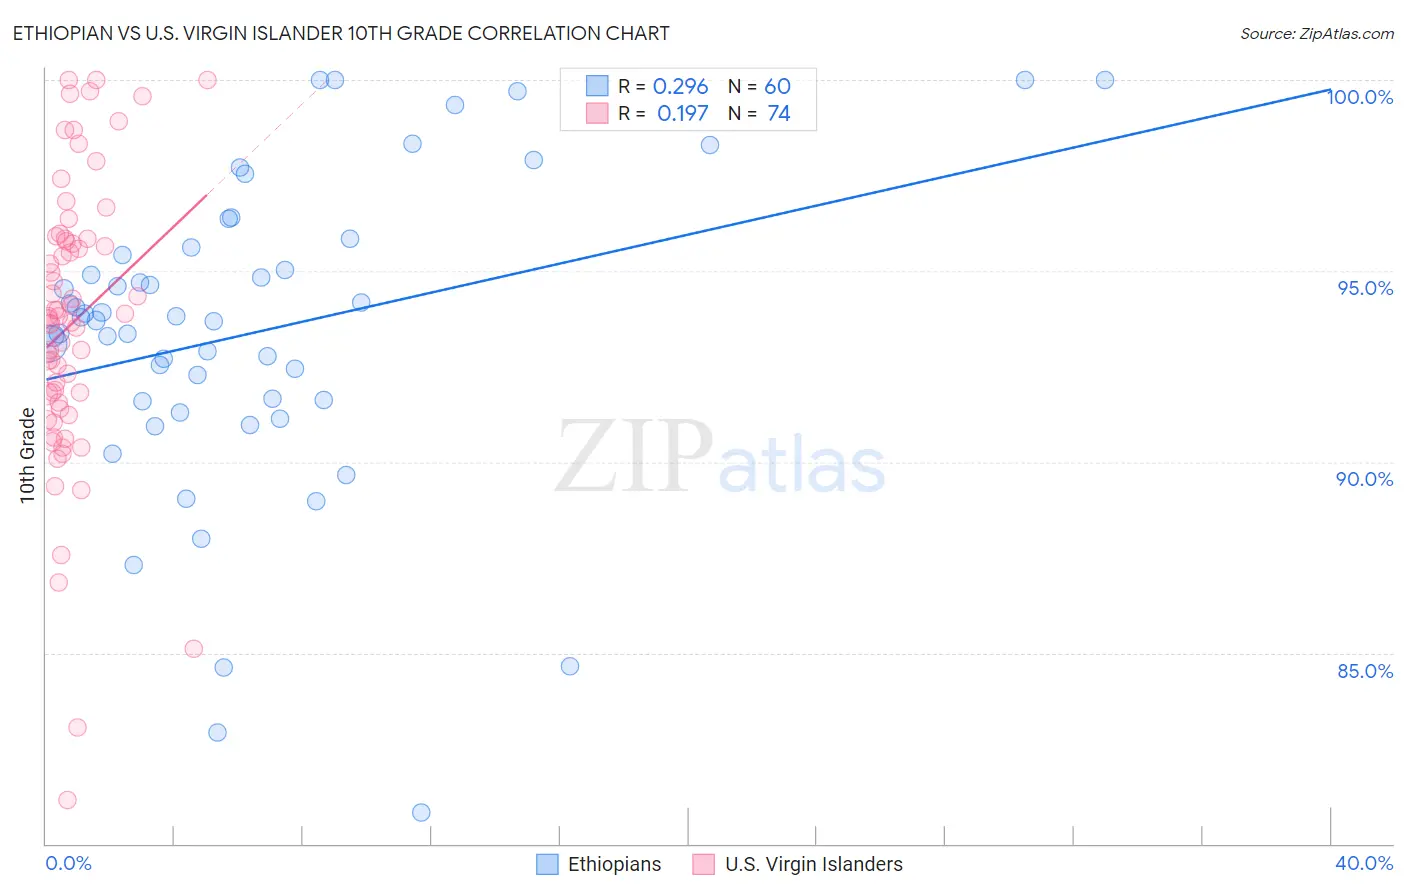
Ethiopian vs U.S. Virgin Islander 10th Grade Correlation Chart
The statistical analysis conducted on geographies consisting of 223,161,778 people shows a weak positive correlation between the proportion of Ethiopians and percentage of population with at least 10th grade education in the United States with a correlation coefficient (R) of 0.296 and weighted average of 93.2%. Similarly, the statistical analysis conducted on geographies consisting of 87,529,315 people shows a poor positive correlation between the proportion of U.S. Virgin Islanders and percentage of population with at least 10th grade education in the United States with a correlation coefficient (R) of 0.197 and weighted average of 92.7%, a difference of 0.58%.
10th Grade Correlation Summary
| Measurement | Ethiopian | U.S. Virgin Islander |
| Minimum | 80.8% | 81.1% |
| Maximum | 100.0% | 100.0% |
| Range | 19.2% | 18.9% |
| Mean | 93.4% | 93.6% |
| Median | 93.7% | 93.8% |
| Interquartile 25% (IQ1) | 91.6% | 91.6% |
| Interquartile 75% (IQ3) | 95.5% | 95.8% |
| Interquartile Range (IQR) | 3.9% | 4.3% |
| Standard Deviation (Sample) | 4.1% | 3.7% |
| Standard Deviation (Population) | 4.1% | 3.7% |
Similar Demographics by 10th Grade
Demographics Similar to Ethiopians by 10th Grade
In terms of 10th grade, the demographic groups most similar to Ethiopians are Immigrants from Sierra Leone (93.2%, a difference of 0.010%), Immigrants from Southern Europe (93.2%, a difference of 0.030%), Bolivian (93.2%, a difference of 0.040%), Tongan (93.3%, a difference of 0.050%), and Seminole (93.3%, a difference of 0.060%).
| Demographics | Rating | Rank | 10th Grade |
| Immigrants | Oceania | 15.1 /100 | #215 | Poor 93.4% |
| Immigrants | Eastern Africa | 14.7 /100 | #216 | Poor 93.4% |
| Portuguese | 12.1 /100 | #217 | Poor 93.3% |
| Immigrants | Liberia | 10.2 /100 | #218 | Poor 93.3% |
| Seminole | 10.2 /100 | #219 | Poor 93.3% |
| Tongans | 9.5 /100 | #220 | Tragic 93.3% |
| Immigrants | Southern Europe | 8.9 /100 | #221 | Tragic 93.2% |
| Ethiopians | 7.9 /100 | #222 | Tragic 93.2% |
| Immigrants | Sierra Leone | 7.6 /100 | #223 | Tragic 93.2% |
| Bolivians | 6.7 /100 | #224 | Tragic 93.2% |
| Somalis | 6.2 /100 | #225 | Tragic 93.2% |
| Koreans | 6.1 /100 | #226 | Tragic 93.2% |
| Blacks/African Americans | 6.0 /100 | #227 | Tragic 93.2% |
| Immigrants | China | 5.9 /100 | #228 | Tragic 93.2% |
| Immigrants | Ethiopia | 5.1 /100 | #229 | Tragic 93.1% |
Demographics Similar to U.S. Virgin Islanders by 10th Grade
In terms of 10th grade, the demographic groups most similar to U.S. Virgin Islanders are Immigrants from Nigeria (92.7%, a difference of 0.010%), Immigrants from Costa Rica (92.7%, a difference of 0.010%), Immigrants from Bolivia (92.7%, a difference of 0.020%), Immigrants from Jamaica (92.6%, a difference of 0.040%), and Immigrants from Uzbekistan (92.6%, a difference of 0.060%).
| Demographics | Rating | Rank | 10th Grade |
| Jamaicans | 1.2 /100 | #250 | Tragic 92.8% |
| Immigrants | Thailand | 1.0 /100 | #251 | Tragic 92.8% |
| South Americans | 0.9 /100 | #252 | Tragic 92.8% |
| Ghanaians | 0.9 /100 | #253 | Tragic 92.8% |
| Armenians | 0.9 /100 | #254 | Tragic 92.7% |
| Immigrants | Bolivia | 0.7 /100 | #255 | Tragic 92.7% |
| Immigrants | Nigeria | 0.7 /100 | #256 | Tragic 92.7% |
| U.S. Virgin Islanders | 0.7 /100 | #257 | Tragic 92.7% |
| Immigrants | Costa Rica | 0.6 /100 | #258 | Tragic 92.7% |
| Immigrants | Jamaica | 0.5 /100 | #259 | Tragic 92.6% |
| Immigrants | Uzbekistan | 0.5 /100 | #260 | Tragic 92.6% |
| Paiute | 0.4 /100 | #261 | Tragic 92.6% |
| Immigrants | South America | 0.4 /100 | #262 | Tragic 92.6% |
| Apache | 0.4 /100 | #263 | Tragic 92.6% |
| Peruvians | 0.4 /100 | #264 | Tragic 92.6% |