Ethiopian vs Immigrants from Portugal 10th Grade
COMPARE
Ethiopian
Immigrants from Portugal
10th Grade
10th Grade Comparison
Ethiopians
Immigrants from Portugal
93.2%
10TH GRADE
7.9/ 100
METRIC RATING
222nd/ 347
METRIC RANK
90.8%
10TH GRADE
0.0/ 100
METRIC RATING
312th/ 347
METRIC RANK
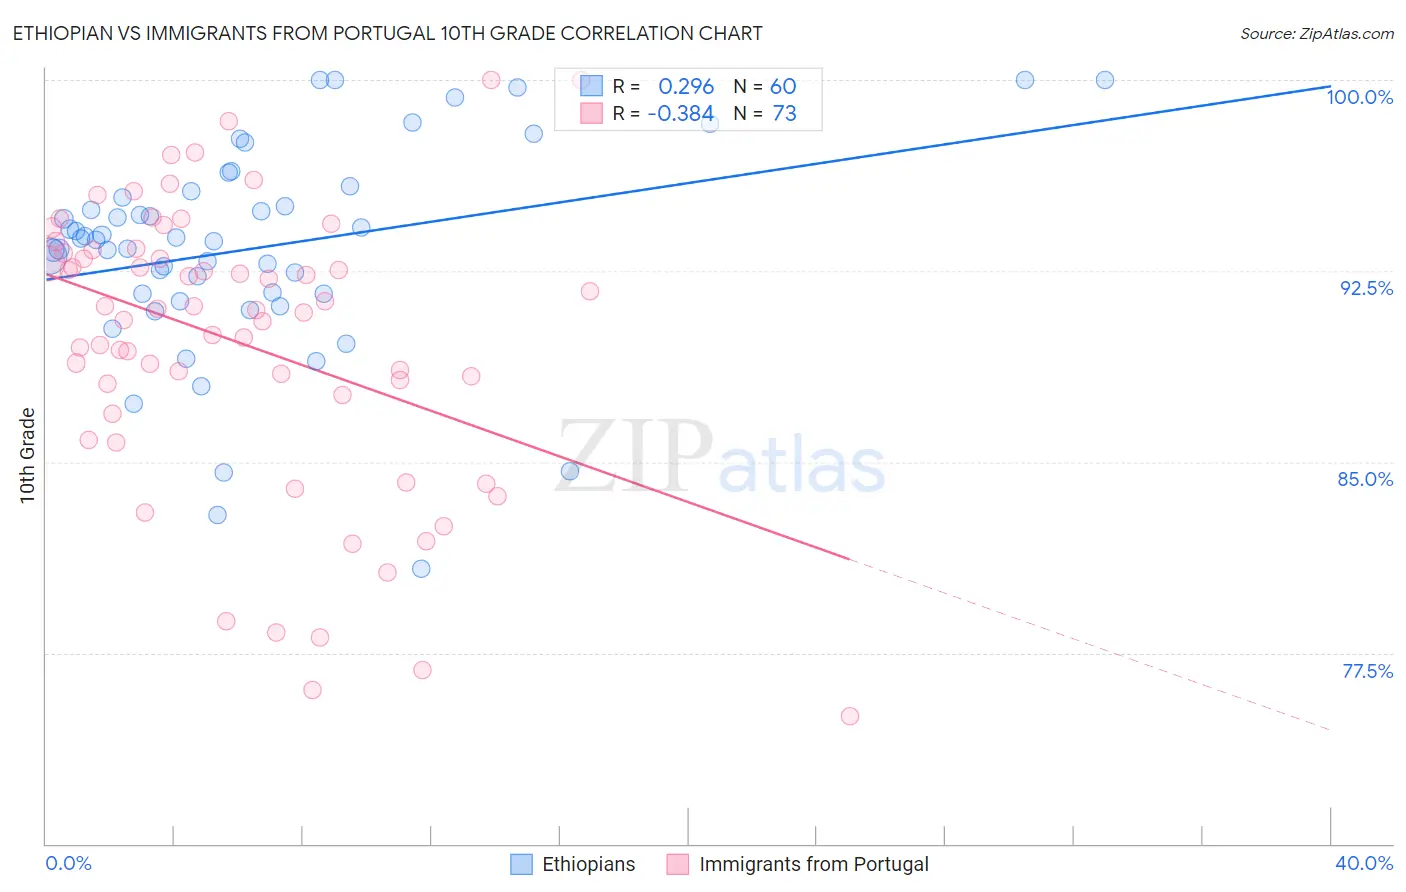
Ethiopian vs Immigrants from Portugal 10th Grade Correlation Chart
The statistical analysis conducted on geographies consisting of 223,161,778 people shows a weak positive correlation between the proportion of Ethiopians and percentage of population with at least 10th grade education in the United States with a correlation coefficient (R) of 0.296 and weighted average of 93.2%. Similarly, the statistical analysis conducted on geographies consisting of 174,792,107 people shows a mild negative correlation between the proportion of Immigrants from Portugal and percentage of population with at least 10th grade education in the United States with a correlation coefficient (R) of -0.384 and weighted average of 90.8%, a difference of 2.7%.
10th Grade Correlation Summary
| Measurement | Ethiopian | Immigrants from Portugal |
| Minimum | 80.8% | 75.0% |
| Maximum | 100.0% | 100.0% |
| Range | 19.2% | 25.0% |
| Mean | 93.4% | 89.7% |
| Median | 93.7% | 91.0% |
| Interquartile 25% (IQ1) | 91.6% | 87.3% |
| Interquartile 75% (IQ3) | 95.5% | 93.3% |
| Interquartile Range (IQR) | 3.9% | 6.0% |
| Standard Deviation (Sample) | 4.1% | 5.6% |
| Standard Deviation (Population) | 4.1% | 5.6% |
Similar Demographics by 10th Grade
Demographics Similar to Ethiopians by 10th Grade
In terms of 10th grade, the demographic groups most similar to Ethiopians are Immigrants from Sierra Leone (93.2%, a difference of 0.010%), Immigrants from Southern Europe (93.2%, a difference of 0.030%), Bolivian (93.2%, a difference of 0.040%), Tongan (93.3%, a difference of 0.050%), and Seminole (93.3%, a difference of 0.060%).
| Demographics | Rating | Rank | 10th Grade |
| Immigrants | Oceania | 15.1 /100 | #215 | Poor 93.4% |
| Immigrants | Eastern Africa | 14.7 /100 | #216 | Poor 93.4% |
| Portuguese | 12.1 /100 | #217 | Poor 93.3% |
| Immigrants | Liberia | 10.2 /100 | #218 | Poor 93.3% |
| Seminole | 10.2 /100 | #219 | Poor 93.3% |
| Tongans | 9.5 /100 | #220 | Tragic 93.3% |
| Immigrants | Southern Europe | 8.9 /100 | #221 | Tragic 93.2% |
| Ethiopians | 7.9 /100 | #222 | Tragic 93.2% |
| Immigrants | Sierra Leone | 7.6 /100 | #223 | Tragic 93.2% |
| Bolivians | 6.7 /100 | #224 | Tragic 93.2% |
| Somalis | 6.2 /100 | #225 | Tragic 93.2% |
| Koreans | 6.1 /100 | #226 | Tragic 93.2% |
| Blacks/African Americans | 6.0 /100 | #227 | Tragic 93.2% |
| Immigrants | China | 5.9 /100 | #228 | Tragic 93.2% |
| Immigrants | Ethiopia | 5.1 /100 | #229 | Tragic 93.1% |
Demographics Similar to Immigrants from Portugal by 10th Grade
In terms of 10th grade, the demographic groups most similar to Immigrants from Portugal are Cape Verdean (90.8%, a difference of 0.030%), Nepalese (90.7%, a difference of 0.11%), Immigrants from Cambodia (90.9%, a difference of 0.16%), Vietnamese (90.9%, a difference of 0.19%), and Immigrants from Caribbean (90.6%, a difference of 0.19%).
| Demographics | Rating | Rank | 10th Grade |
| Immigrants | Dominica | 0.0 /100 | #305 | Tragic 91.1% |
| Yaqui | 0.0 /100 | #306 | Tragic 91.1% |
| Immigrants | Fiji | 0.0 /100 | #307 | Tragic 91.0% |
| Immigrants | Bangladesh | 0.0 /100 | #308 | Tragic 91.0% |
| Immigrants | Immigrants | 0.0 /100 | #309 | Tragic 91.0% |
| Vietnamese | 0.0 /100 | #310 | Tragic 90.9% |
| Immigrants | Cambodia | 0.0 /100 | #311 | Tragic 90.9% |
| Immigrants | Portugal | 0.0 /100 | #312 | Tragic 90.8% |
| Cape Verdeans | 0.0 /100 | #313 | Tragic 90.8% |
| Nepalese | 0.0 /100 | #314 | Tragic 90.7% |
| Immigrants | Caribbean | 0.0 /100 | #315 | Tragic 90.6% |
| Ecuadorians | 0.0 /100 | #316 | Tragic 90.6% |
| Immigrants | Ecuador | 0.0 /100 | #317 | Tragic 90.4% |
| Immigrants | Cuba | 0.0 /100 | #318 | Tragic 90.2% |
| Nicaraguans | 0.0 /100 | #319 | Tragic 90.2% |