Estonian vs Immigrants from Kuwait Female Poverty Among 25-34 Year Olds
COMPARE
Estonian
Immigrants from Kuwait
Female Poverty Among 25-34 Year Olds
Female Poverty Among 25-34 Year Olds Comparison
Estonians
Immigrants from Kuwait
12.3%
FEMALE POVERTY AMONG 25-34 YEAR OLDS
98.9/ 100
METRIC RATING
75th/ 347
METRIC RANK
12.8%
FEMALE POVERTY AMONG 25-34 YEAR OLDS
93.1/ 100
METRIC RATING
117th/ 347
METRIC RANK
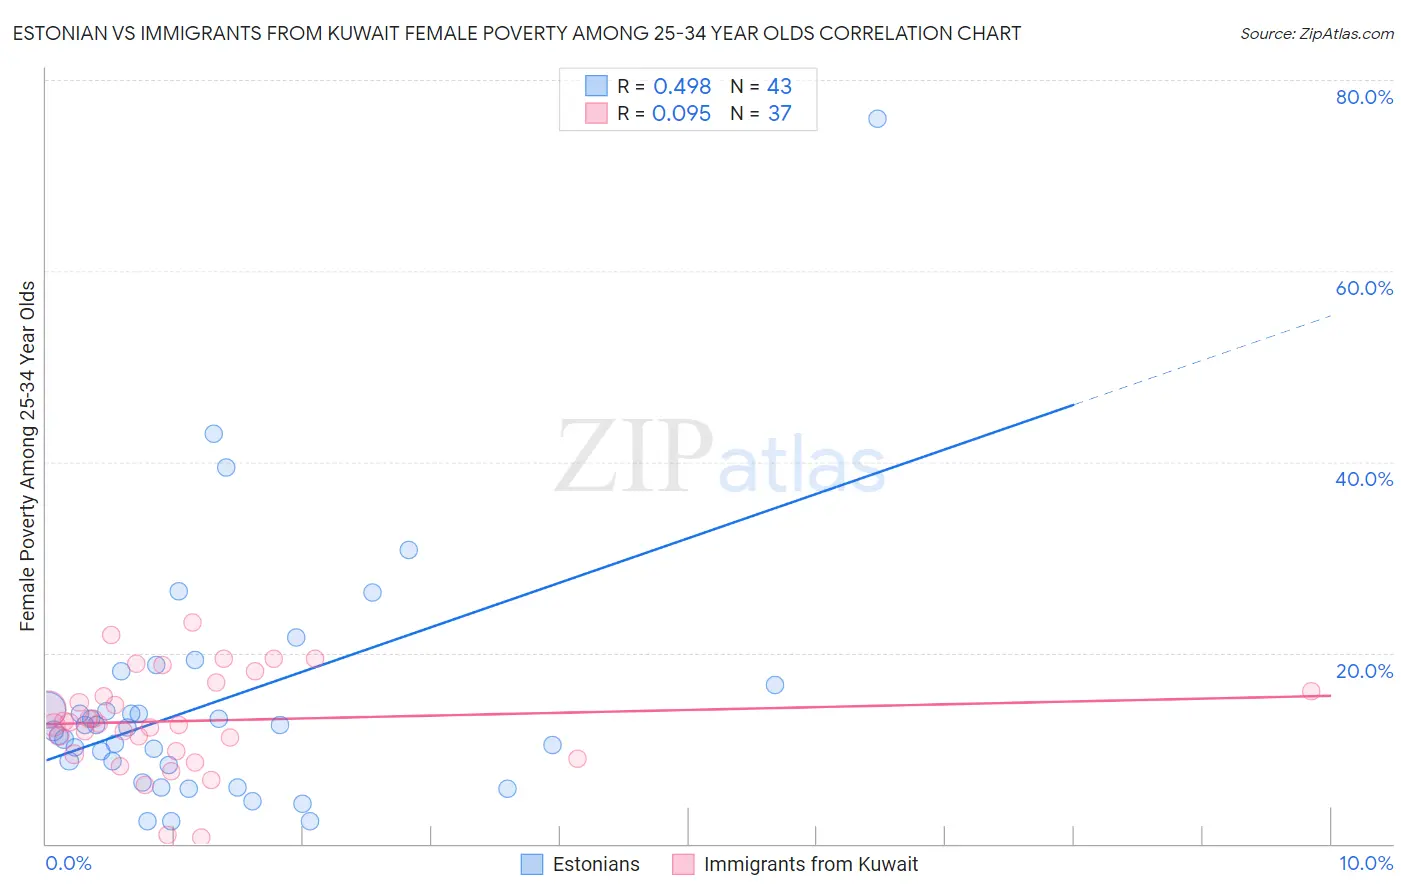
Estonian vs Immigrants from Kuwait Female Poverty Among 25-34 Year Olds Correlation Chart
The statistical analysis conducted on geographies consisting of 122,488,536 people shows a moderate positive correlation between the proportion of Estonians and poverty level among females between the ages 25 and 34 in the United States with a correlation coefficient (R) of 0.498 and weighted average of 12.3%. Similarly, the statistical analysis conducted on geographies consisting of 136,324,073 people shows a slight positive correlation between the proportion of Immigrants from Kuwait and poverty level among females between the ages 25 and 34 in the United States with a correlation coefficient (R) of 0.095 and weighted average of 12.8%, a difference of 4.3%.
Female Poverty Among 25-34 Year Olds Correlation Summary
| Measurement | Estonian | Immigrants from Kuwait |
| Minimum | 2.3% | 0.66% |
| Maximum | 76.0% | 23.2% |
| Range | 73.7% | 22.6% |
| Mean | 14.8% | 12.9% |
| Median | 12.2% | 12.6% |
| Interquartile 25% (IQ1) | 8.2% | 9.5% |
| Interquartile 75% (IQ3) | 16.7% | 16.5% |
| Interquartile Range (IQR) | 8.4% | 6.9% |
| Standard Deviation (Sample) | 13.0% | 5.1% |
| Standard Deviation (Population) | 12.9% | 5.1% |
Similar Demographics by Female Poverty Among 25-34 Year Olds
Demographics Similar to Estonians by Female Poverty Among 25-34 Year Olds
In terms of female poverty among 25-34 year olds, the demographic groups most similar to Estonians are Immigrants from Sweden (12.3%, a difference of 0.050%), Greek (12.3%, a difference of 0.060%), Immigrants from Vietnam (12.3%, a difference of 0.080%), Immigrants from Italy (12.3%, a difference of 0.22%), and Lithuanian (12.2%, a difference of 0.39%).
| Demographics | Rating | Rank | Female Poverty Among 25-34 Year Olds |
| Sri Lankans | 99.1 /100 | #68 | Exceptional 12.2% |
| Immigrants | Lebanon | 99.1 /100 | #69 | Exceptional 12.2% |
| Immigrants | Belgium | 99.1 /100 | #70 | Exceptional 12.2% |
| Immigrants | Scotland | 99.1 /100 | #71 | Exceptional 12.2% |
| Lithuanians | 99.1 /100 | #72 | Exceptional 12.2% |
| Immigrants | Vietnam | 98.9 /100 | #73 | Exceptional 12.3% |
| Immigrants | Sweden | 98.9 /100 | #74 | Exceptional 12.3% |
| Estonians | 98.9 /100 | #75 | Exceptional 12.3% |
| Greeks | 98.9 /100 | #76 | Exceptional 12.3% |
| Immigrants | Italy | 98.8 /100 | #77 | Exceptional 12.3% |
| Immigrants | Ukraine | 98.6 /100 | #78 | Exceptional 12.3% |
| Immigrants | Jordan | 98.5 /100 | #79 | Exceptional 12.4% |
| Immigrants | Malaysia | 98.3 /100 | #80 | Exceptional 12.4% |
| Immigrants | Kazakhstan | 98.1 /100 | #81 | Exceptional 12.4% |
| Ethiopians | 98.0 /100 | #82 | Exceptional 12.4% |
Demographics Similar to Immigrants from Kuwait by Female Poverty Among 25-34 Year Olds
In terms of female poverty among 25-34 year olds, the demographic groups most similar to Immigrants from Kuwait are Mongolian (12.8%, a difference of 0.010%), Immigrants from Nepal (12.8%, a difference of 0.020%), Carpatho Rusyn (12.8%, a difference of 0.030%), Chilean (12.8%, a difference of 0.060%), and Immigrants from Brazil (12.8%, a difference of 0.090%).
| Demographics | Rating | Rank | Female Poverty Among 25-34 Year Olds |
| Australians | 94.1 /100 | #110 | Exceptional 12.8% |
| Danes | 93.9 /100 | #111 | Exceptional 12.8% |
| Immigrants | Morocco | 93.9 /100 | #112 | Exceptional 12.8% |
| Immigrants | Syria | 93.8 /100 | #113 | Exceptional 12.8% |
| Immigrants | Southern Europe | 93.6 /100 | #114 | Exceptional 12.8% |
| Immigrants | Brazil | 93.3 /100 | #115 | Exceptional 12.8% |
| Chileans | 93.2 /100 | #116 | Exceptional 12.8% |
| Immigrants | Kuwait | 93.1 /100 | #117 | Exceptional 12.8% |
| Mongolians | 93.0 /100 | #118 | Exceptional 12.8% |
| Immigrants | Nepal | 93.0 /100 | #119 | Exceptional 12.8% |
| Carpatho Rusyns | 93.0 /100 | #120 | Exceptional 12.8% |
| Romanians | 92.8 /100 | #121 | Exceptional 12.8% |
| Immigrants | Western Asia | 92.7 /100 | #122 | Exceptional 12.8% |
| Slovenes | 92.7 /100 | #123 | Exceptional 12.8% |
| Immigrants | Netherlands | 92.0 /100 | #124 | Exceptional 12.8% |