Estonian vs Immigrants from Guyana 10th Grade
COMPARE
Estonian
Immigrants from Guyana
10th Grade
10th Grade Comparison
Estonians
Immigrants from Guyana
95.3%
10TH GRADE
99.9/ 100
METRIC RATING
35th/ 347
METRIC RANK
91.2%
10TH GRADE
0.0/ 100
METRIC RATING
302nd/ 347
METRIC RANK
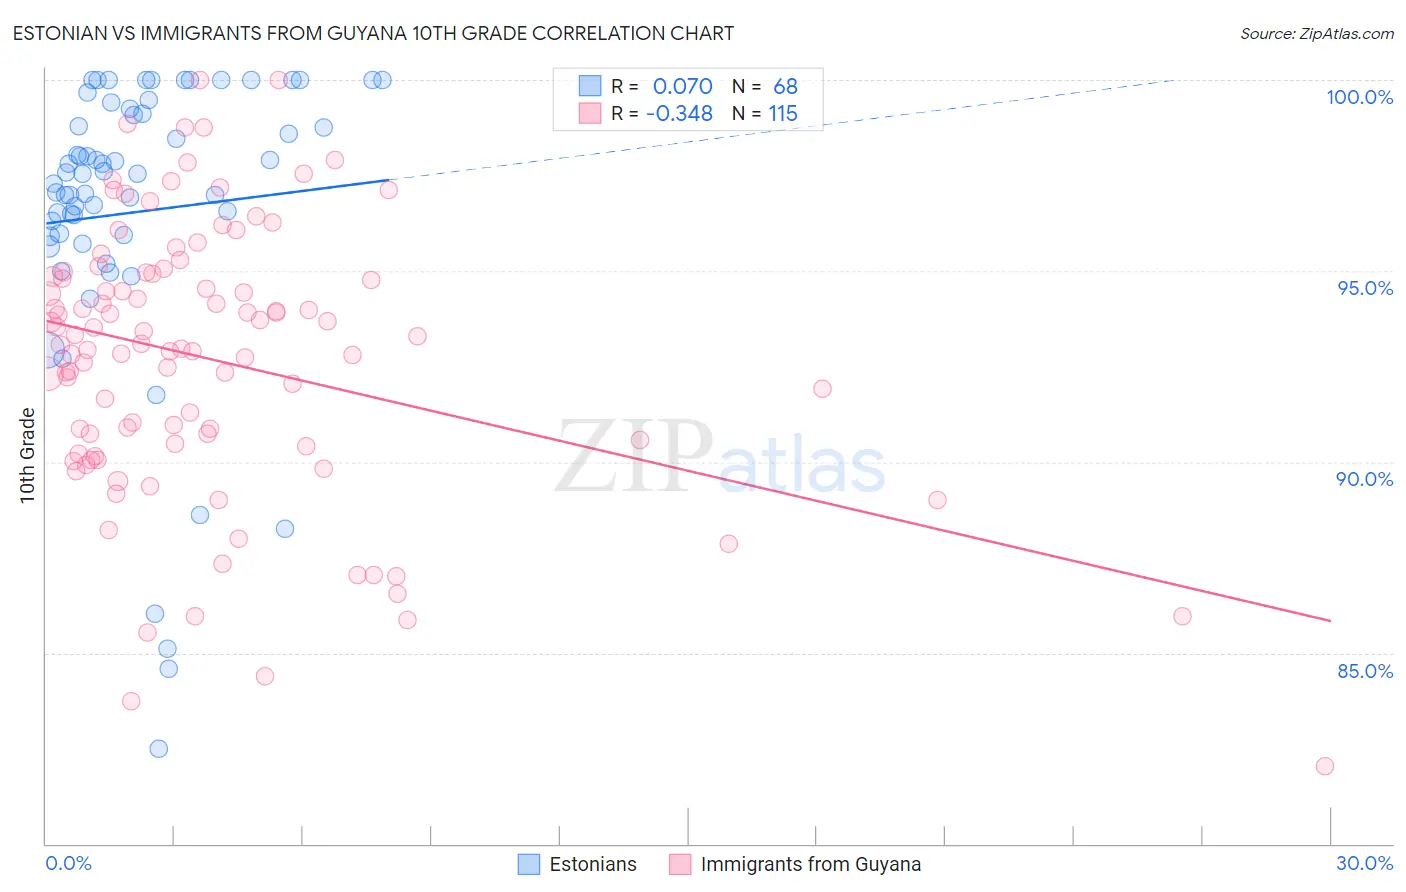
Estonian vs Immigrants from Guyana 10th Grade Correlation Chart
The statistical analysis conducted on geographies consisting of 123,528,404 people shows a slight positive correlation between the proportion of Estonians and percentage of population with at least 10th grade education in the United States with a correlation coefficient (R) of 0.070 and weighted average of 95.3%. Similarly, the statistical analysis conducted on geographies consisting of 183,673,461 people shows a mild negative correlation between the proportion of Immigrants from Guyana and percentage of population with at least 10th grade education in the United States with a correlation coefficient (R) of -0.348 and weighted average of 91.2%, a difference of 4.5%.
10th Grade Correlation Summary
| Measurement | Estonian | Immigrants from Guyana |
| Minimum | 82.5% | 82.0% |
| Maximum | 100.0% | 100.0% |
| Range | 17.5% | 18.0% |
| Mean | 96.5% | 92.7% |
| Median | 97.5% | 93.1% |
| Interquartile 25% (IQ1) | 95.9% | 90.4% |
| Interquartile 75% (IQ3) | 99.2% | 94.9% |
| Interquartile Range (IQR) | 3.3% | 4.5% |
| Standard Deviation (Sample) | 3.9% | 3.6% |
| Standard Deviation (Population) | 3.9% | 3.6% |
Similar Demographics by 10th Grade
Demographics Similar to Estonians by 10th Grade
In terms of 10th grade, the demographic groups most similar to Estonians are British (95.3%, a difference of 0.010%), Immigrants from India (95.3%, a difference of 0.010%), Iranian (95.3%, a difference of 0.020%), Hungarian (95.3%, a difference of 0.020%), and French (95.3%, a difference of 0.020%).
| Demographics | Rating | Rank | 10th Grade |
| Luxembourgers | 100.0 /100 | #28 | Exceptional 95.4% |
| Bulgarians | 100.0 /100 | #29 | Exceptional 95.4% |
| Belgians | 100.0 /100 | #30 | Exceptional 95.4% |
| Iranians | 100.0 /100 | #31 | Exceptional 95.3% |
| Hungarians | 100.0 /100 | #32 | Exceptional 95.3% |
| French | 100.0 /100 | #33 | Exceptional 95.3% |
| British | 99.9 /100 | #34 | Exceptional 95.3% |
| Estonians | 99.9 /100 | #35 | Exceptional 95.3% |
| Immigrants | India | 99.9 /100 | #36 | Exceptional 95.3% |
| French Canadians | 99.9 /100 | #37 | Exceptional 95.3% |
| Northern Europeans | 99.9 /100 | #38 | Exceptional 95.3% |
| Immigrants | Scotland | 99.9 /100 | #39 | Exceptional 95.2% |
| Scotch-Irish | 99.9 /100 | #40 | Exceptional 95.2% |
| Russians | 99.9 /100 | #41 | Exceptional 95.2% |
| Slavs | 99.9 /100 | #42 | Exceptional 95.2% |
Demographics Similar to Immigrants from Guyana by 10th Grade
In terms of 10th grade, the demographic groups most similar to Immigrants from Guyana are Japanese (91.2%, a difference of 0.010%), Immigrants from Vietnam (91.2%, a difference of 0.020%), Pima (91.2%, a difference of 0.080%), Immigrants from Dominica (91.1%, a difference of 0.090%), and Yaqui (91.1%, a difference of 0.15%).
| Demographics | Rating | Rank | 10th Grade |
| Lumbee | 0.0 /100 | #295 | Tragic 91.7% |
| Immigrants | Grenada | 0.0 /100 | #296 | Tragic 91.6% |
| Fijians | 0.0 /100 | #297 | Tragic 91.5% |
| Cubans | 0.0 /100 | #298 | Tragic 91.5% |
| Immigrants | Haiti | 0.0 /100 | #299 | Tragic 91.4% |
| Guyanese | 0.0 /100 | #300 | Tragic 91.4% |
| Japanese | 0.0 /100 | #301 | Tragic 91.2% |
| Immigrants | Guyana | 0.0 /100 | #302 | Tragic 91.2% |
| Immigrants | Vietnam | 0.0 /100 | #303 | Tragic 91.2% |
| Pima | 0.0 /100 | #304 | Tragic 91.2% |
| Immigrants | Dominica | 0.0 /100 | #305 | Tragic 91.1% |
| Yaqui | 0.0 /100 | #306 | Tragic 91.1% |
| Immigrants | Fiji | 0.0 /100 | #307 | Tragic 91.0% |
| Immigrants | Bangladesh | 0.0 /100 | #308 | Tragic 91.0% |
| Immigrants | Immigrants | 0.0 /100 | #309 | Tragic 91.0% |