European vs Immigrants from El Salvador Doctorate Degree
COMPARE
European
Immigrants from El Salvador
Doctorate Degree
Doctorate Degree Comparison
Europeans
Immigrants from El Salvador
2.1%
DOCTORATE DEGREE
97.5/ 100
METRIC RATING
107th/ 347
METRIC RANK
1.4%
DOCTORATE DEGREE
0.3/ 100
METRIC RATING
288th/ 347
METRIC RANK
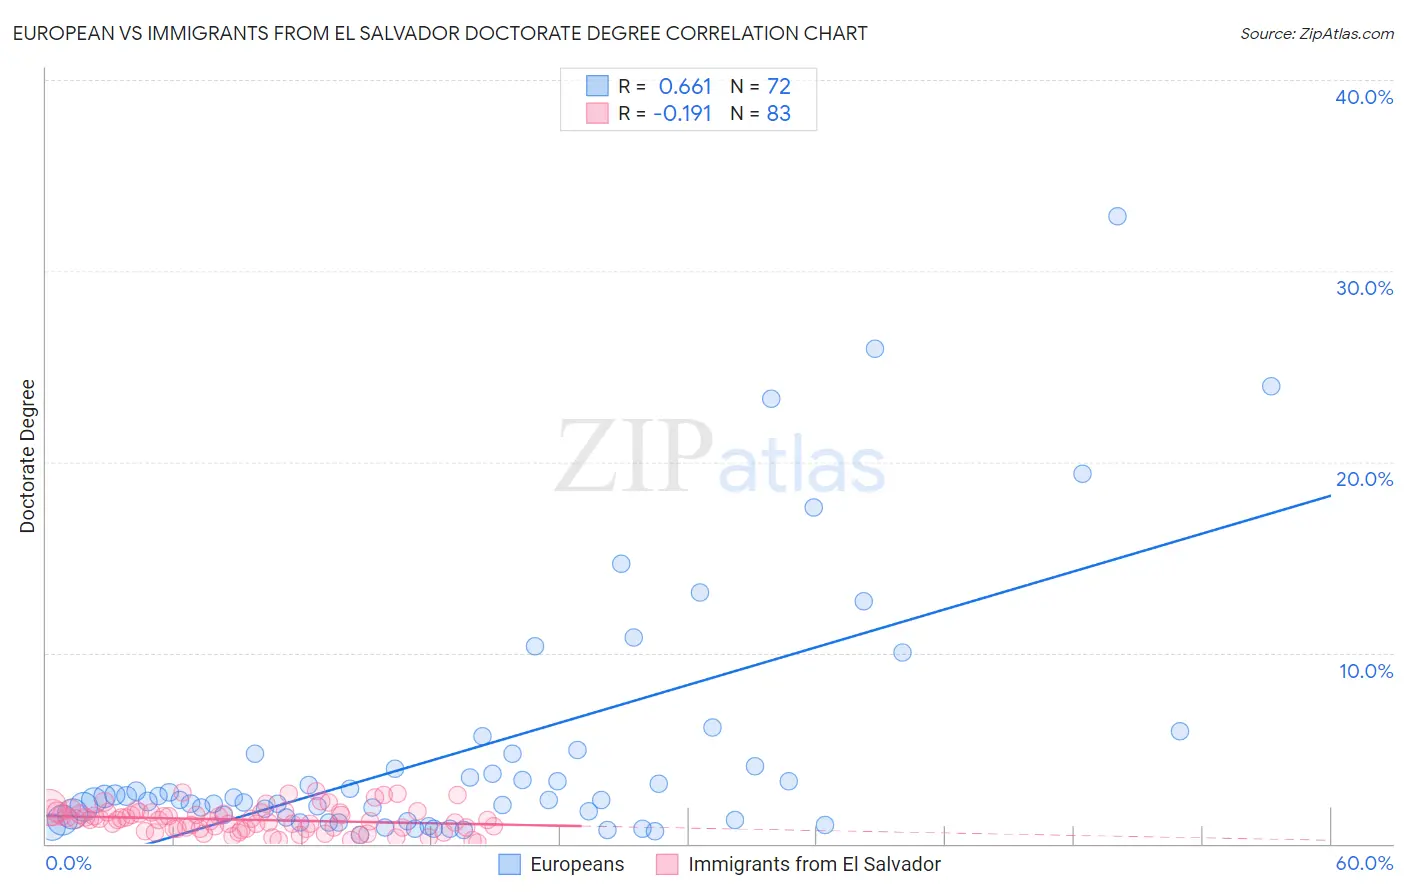
European vs Immigrants from El Salvador Doctorate Degree Correlation Chart
The statistical analysis conducted on geographies consisting of 540,466,833 people shows a significant positive correlation between the proportion of Europeans and percentage of population with at least doctorate degree education in the United States with a correlation coefficient (R) of 0.661 and weighted average of 2.1%. Similarly, the statistical analysis conducted on geographies consisting of 353,263,202 people shows a poor negative correlation between the proportion of Immigrants from El Salvador and percentage of population with at least doctorate degree education in the United States with a correlation coefficient (R) of -0.191 and weighted average of 1.4%, a difference of 43.9%.
Doctorate Degree Correlation Summary
| Measurement | European | Immigrants from El Salvador |
| Minimum | 0.48% | 0.038% |
| Maximum | 32.8% | 2.7% |
| Range | 32.4% | 2.7% |
| Mean | 4.9% | 1.3% |
| Median | 2.3% | 1.3% |
| Interquartile 25% (IQ1) | 1.3% | 0.80% |
| Interquartile 75% (IQ3) | 4.4% | 1.6% |
| Interquartile Range (IQR) | 3.1% | 0.82% |
| Standard Deviation (Sample) | 6.6% | 0.65% |
| Standard Deviation (Population) | 6.6% | 0.64% |
Similar Demographics by Doctorate Degree
Demographics Similar to Europeans by Doctorate Degree
In terms of doctorate degree, the demographic groups most similar to Europeans are Immigrants from Germany (2.1%, a difference of 0.22%), Ukrainian (2.1%, a difference of 0.28%), Brazilian (2.1%, a difference of 0.35%), Sudanese (2.1%, a difference of 0.39%), and Immigrants from Pakistan (2.1%, a difference of 0.41%).
| Demographics | Rating | Rank | Doctorate Degree |
| Immigrants | Eastern Europe | 98.2 /100 | #100 | Exceptional 2.1% |
| Immigrants | Eastern Africa | 98.2 /100 | #101 | Exceptional 2.1% |
| Immigrants | Chile | 98.1 /100 | #102 | Exceptional 2.1% |
| Romanians | 98.1 /100 | #103 | Exceptional 2.1% |
| Austrians | 98.0 /100 | #104 | Exceptional 2.1% |
| Arabs | 97.8 /100 | #105 | Exceptional 2.1% |
| Sudanese | 97.7 /100 | #106 | Exceptional 2.1% |
| Europeans | 97.5 /100 | #107 | Exceptional 2.1% |
| Immigrants | Germany | 97.3 /100 | #108 | Exceptional 2.1% |
| Ukrainians | 97.2 /100 | #109 | Exceptional 2.1% |
| Brazilians | 97.2 /100 | #110 | Exceptional 2.1% |
| Immigrants | Pakistan | 97.1 /100 | #111 | Exceptional 2.1% |
| Syrians | 97.1 /100 | #112 | Exceptional 2.1% |
| Immigrants | Italy | 96.9 /100 | #113 | Exceptional 2.1% |
| Immigrants | Croatia | 96.8 /100 | #114 | Exceptional 2.1% |
Demographics Similar to Immigrants from El Salvador by Doctorate Degree
In terms of doctorate degree, the demographic groups most similar to Immigrants from El Salvador are Cape Verdean (1.4%, a difference of 0.14%), Choctaw (1.4%, a difference of 0.15%), Cajun (1.5%, a difference of 0.18%), Cherokee (1.5%, a difference of 0.34%), and Black/African American (1.4%, a difference of 0.38%).
| Demographics | Rating | Rank | Doctorate Degree |
| Tohono O'odham | 0.4 /100 | #281 | Tragic 1.5% |
| British West Indians | 0.3 /100 | #282 | Tragic 1.5% |
| Central Americans | 0.3 /100 | #283 | Tragic 1.5% |
| Jamaicans | 0.3 /100 | #284 | Tragic 1.5% |
| Malaysians | 0.3 /100 | #285 | Tragic 1.5% |
| Cherokee | 0.3 /100 | #286 | Tragic 1.5% |
| Cajuns | 0.3 /100 | #287 | Tragic 1.5% |
| Immigrants | El Salvador | 0.3 /100 | #288 | Tragic 1.4% |
| Cape Verdeans | 0.3 /100 | #289 | Tragic 1.4% |
| Choctaw | 0.3 /100 | #290 | Tragic 1.4% |
| Blacks/African Americans | 0.3 /100 | #291 | Tragic 1.4% |
| Alaska Natives | 0.3 /100 | #292 | Tragic 1.4% |
| Immigrants | Yemen | 0.2 /100 | #293 | Tragic 1.4% |
| Samoans | 0.2 /100 | #294 | Tragic 1.4% |
| Guatemalans | 0.2 /100 | #295 | Tragic 1.4% |