Egyptian vs Hispanic or Latino Master's Degree
COMPARE
Egyptian
Hispanic or Latino
Master's Degree
Master's Degree Comparison
Egyptians
Hispanics or Latinos
17.6%
MASTER'S DEGREE
99.6/ 100
METRIC RATING
75th/ 347
METRIC RANK
10.9%
MASTER'S DEGREE
0.0/ 100
METRIC RATING
316th/ 347
METRIC RANK
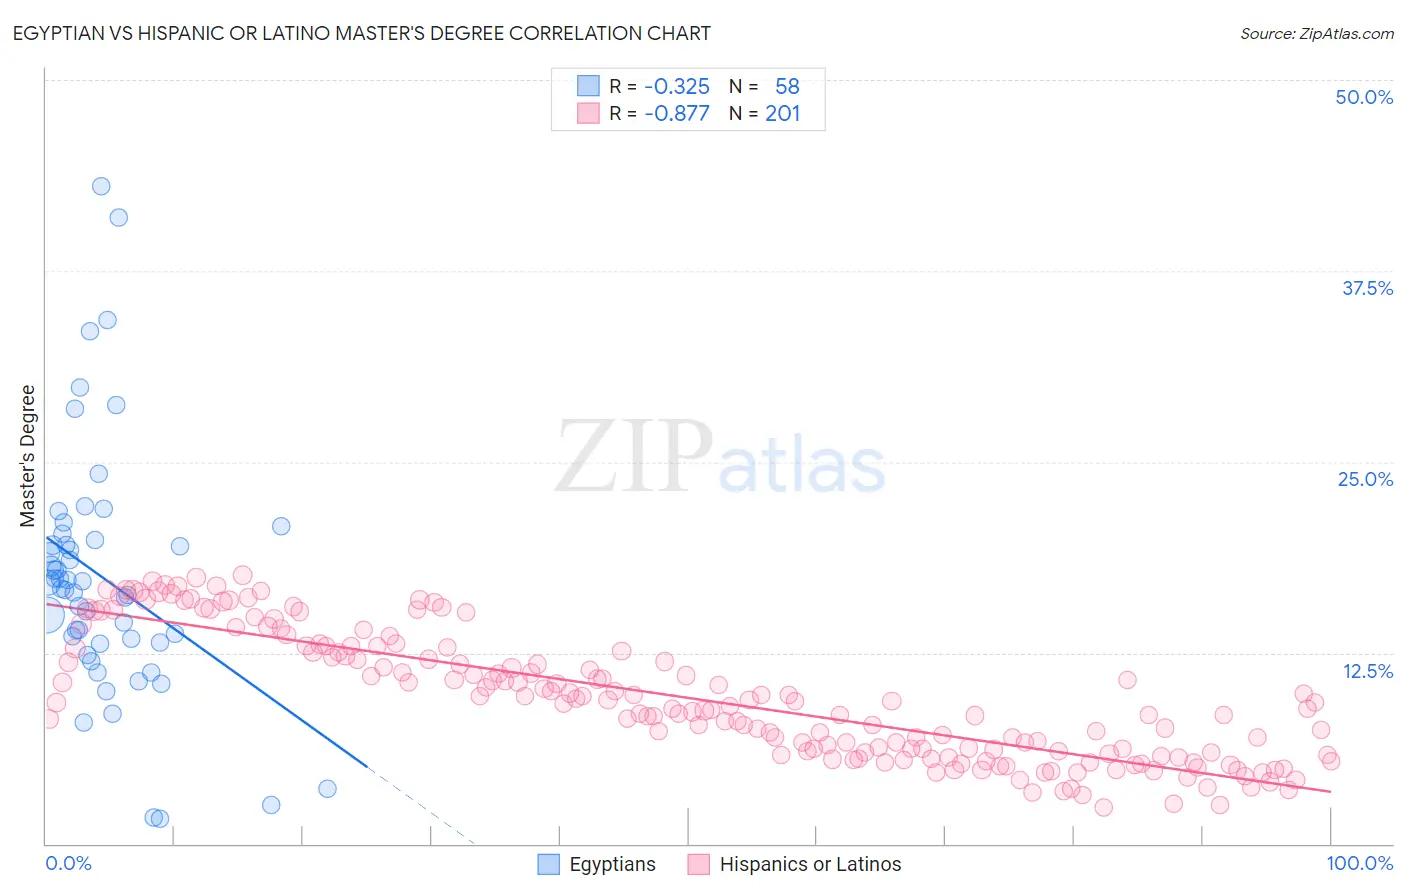
Egyptian vs Hispanic or Latino Master's Degree Correlation Chart
The statistical analysis conducted on geographies consisting of 276,863,578 people shows a mild negative correlation between the proportion of Egyptians and percentage of population with at least master's degree education in the United States with a correlation coefficient (R) of -0.325 and weighted average of 17.6%. Similarly, the statistical analysis conducted on geographies consisting of 577,228,232 people shows a very strong negative correlation between the proportion of Hispanics or Latinos and percentage of population with at least master's degree education in the United States with a correlation coefficient (R) of -0.877 and weighted average of 10.9%, a difference of 61.1%.
Master's Degree Correlation Summary
| Measurement | Egyptian | Hispanic or Latino |
| Minimum | 1.6% | 2.4% |
| Maximum | 43.1% | 17.6% |
| Range | 41.4% | 15.2% |
| Mean | 17.4% | 9.5% |
| Median | 16.9% | 9.2% |
| Interquartile 25% (IQ1) | 13.2% | 5.9% |
| Interquartile 75% (IQ3) | 19.9% | 12.7% |
| Interquartile Range (IQR) | 6.7% | 6.8% |
| Standard Deviation (Sample) | 8.2% | 4.1% |
| Standard Deviation (Population) | 8.1% | 4.1% |
Similar Demographics by Master's Degree
Demographics Similar to Egyptians by Master's Degree
In terms of master's degree, the demographic groups most similar to Egyptians are Immigrants from Indonesia (17.6%, a difference of 0.030%), Immigrants from Eastern Europe (17.6%, a difference of 0.14%), Immigrants from Hungary (17.5%, a difference of 0.34%), Immigrants from Romania (17.7%, a difference of 0.38%), and Immigrants from Lebanon (17.5%, a difference of 0.47%).
| Demographics | Rating | Rank | Master's Degree |
| Immigrants | Ethiopia | 99.8 /100 | #68 | Exceptional 17.9% |
| Immigrants | Uzbekistan | 99.8 /100 | #69 | Exceptional 17.9% |
| Immigrants | Western Europe | 99.8 /100 | #70 | Exceptional 17.8% |
| Immigrants | Pakistan | 99.7 /100 | #71 | Exceptional 17.8% |
| Lithuanians | 99.7 /100 | #72 | Exceptional 17.7% |
| Zimbabweans | 99.7 /100 | #73 | Exceptional 17.7% |
| Immigrants | Romania | 99.7 /100 | #74 | Exceptional 17.7% |
| Egyptians | 99.6 /100 | #75 | Exceptional 17.6% |
| Immigrants | Indonesia | 99.6 /100 | #76 | Exceptional 17.6% |
| Immigrants | Eastern Europe | 99.6 /100 | #77 | Exceptional 17.6% |
| Immigrants | Hungary | 99.6 /100 | #78 | Exceptional 17.5% |
| Immigrants | Lebanon | 99.6 /100 | #79 | Exceptional 17.5% |
| Carpatho Rusyns | 99.6 /100 | #80 | Exceptional 17.5% |
| Immigrants | Western Asia | 99.5 /100 | #81 | Exceptional 17.5% |
| Greeks | 99.5 /100 | #82 | Exceptional 17.5% |
Demographics Similar to Hispanics or Latinos by Master's Degree
In terms of master's degree, the demographic groups most similar to Hispanics or Latinos are Apache (11.0%, a difference of 0.34%), Cajun (11.0%, a difference of 0.35%), Hopi (10.9%, a difference of 0.54%), Immigrants from Cuba (10.9%, a difference of 0.67%), and Yaqui (11.0%, a difference of 0.74%).
| Demographics | Rating | Rank | Master's Degree |
| Puget Sound Salish | 0.0 /100 | #309 | Tragic 11.1% |
| Shoshone | 0.0 /100 | #310 | Tragic 11.1% |
| Seminole | 0.0 /100 | #311 | Tragic 11.0% |
| Choctaw | 0.0 /100 | #312 | Tragic 11.0% |
| Yaqui | 0.0 /100 | #313 | Tragic 11.0% |
| Cajuns | 0.0 /100 | #314 | Tragic 11.0% |
| Apache | 0.0 /100 | #315 | Tragic 11.0% |
| Hispanics or Latinos | 0.0 /100 | #316 | Tragic 10.9% |
| Hopi | 0.0 /100 | #317 | Tragic 10.9% |
| Immigrants | Cuba | 0.0 /100 | #318 | Tragic 10.9% |
| Kiowa | 0.0 /100 | #319 | Tragic 10.8% |
| Immigrants | Micronesia | 0.0 /100 | #320 | Tragic 10.8% |
| Pennsylvania Germans | 0.0 /100 | #321 | Tragic 10.7% |
| Sioux | 0.0 /100 | #322 | Tragic 10.7% |
| Crow | 0.0 /100 | #323 | Tragic 10.6% |