Egyptian vs Comanche 9th Grade
COMPARE
Egyptian
Comanche
9th Grade
9th Grade Comparison
Egyptians
Comanche
95.0%
9TH GRADE
70.1/ 100
METRIC RATING
158th/ 347
METRIC RANK
94.6%
9TH GRADE
14.9/ 100
METRIC RATING
209th/ 347
METRIC RANK
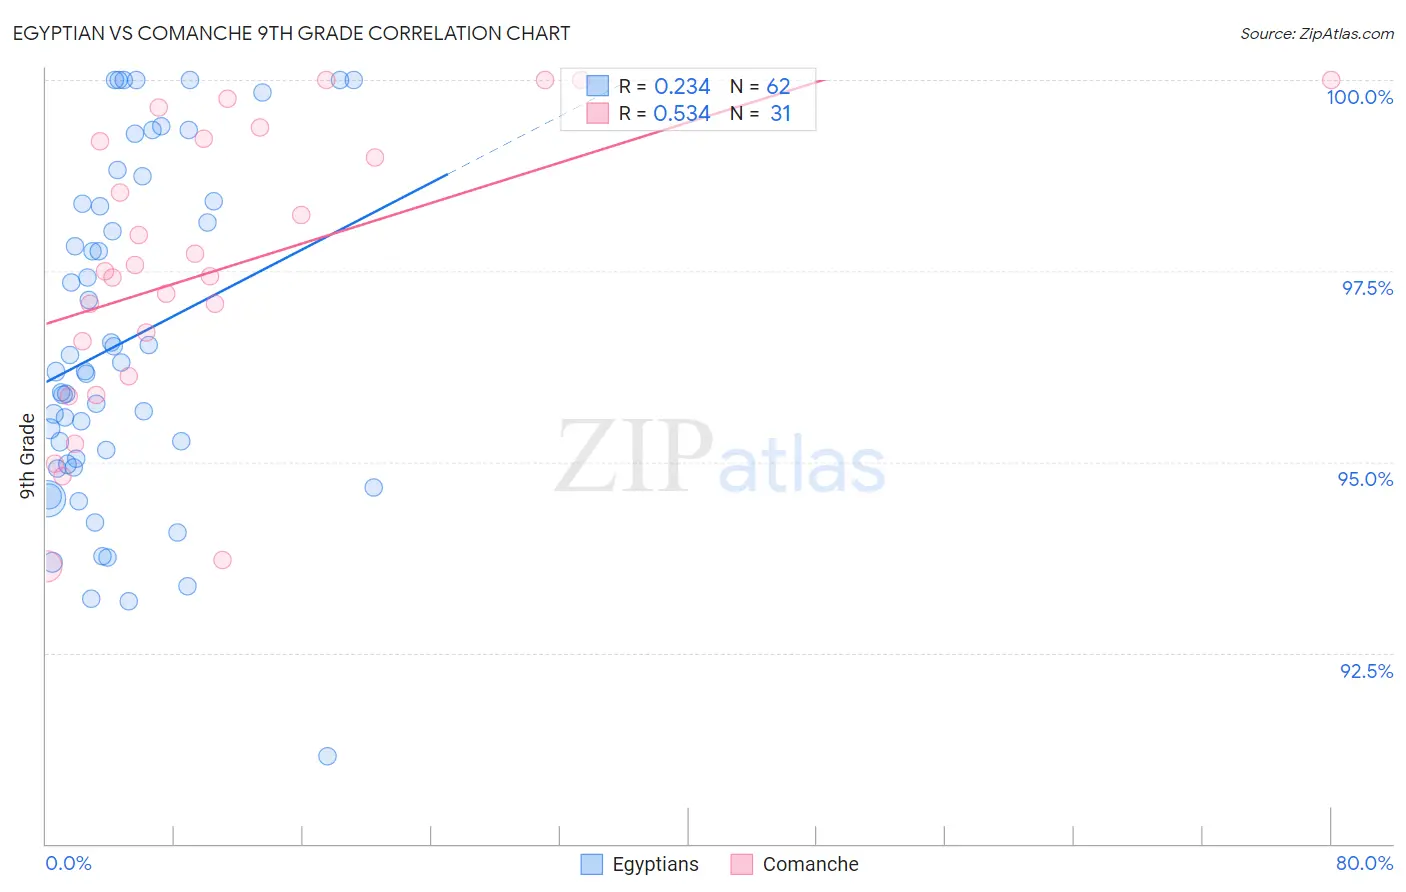
Egyptian vs Comanche 9th Grade Correlation Chart
The statistical analysis conducted on geographies consisting of 276,927,423 people shows a weak positive correlation between the proportion of Egyptians and percentage of population with at least 9th grade education in the United States with a correlation coefficient (R) of 0.234 and weighted average of 95.0%. Similarly, the statistical analysis conducted on geographies consisting of 109,786,530 people shows a substantial positive correlation between the proportion of Comanche and percentage of population with at least 9th grade education in the United States with a correlation coefficient (R) of 0.534 and weighted average of 94.6%, a difference of 0.48%.
9th Grade Correlation Summary
| Measurement | Egyptian | Comanche |
| Minimum | 91.1% | 93.6% |
| Maximum | 100.0% | 100.0% |
| Range | 8.9% | 6.4% |
| Mean | 96.6% | 97.5% |
| Median | 96.2% | 97.5% |
| Interquartile 25% (IQ1) | 95.0% | 96.1% |
| Interquartile 75% (IQ3) | 98.4% | 99.2% |
| Interquartile Range (IQR) | 3.4% | 3.1% |
| Standard Deviation (Sample) | 2.2% | 1.9% |
| Standard Deviation (Population) | 2.2% | 1.8% |
Similar Demographics by 9th Grade
Demographics Similar to Egyptians by 9th Grade
In terms of 9th grade, the demographic groups most similar to Egyptians are Immigrants from Ukraine (95.0%, a difference of 0.020%), Immigrants from Kenya (95.0%, a difference of 0.030%), Mongolian (95.0%, a difference of 0.030%), Immigrants from Italy (95.0%, a difference of 0.030%), and French American Indian (95.0%, a difference of 0.030%).
| Demographics | Rating | Rank | 9th Grade |
| Cajuns | 77.3 /100 | #151 | Good 95.1% |
| Ugandans | 77.0 /100 | #152 | Good 95.1% |
| Albanians | 76.1 /100 | #153 | Good 95.1% |
| Arabs | 74.9 /100 | #154 | Good 95.1% |
| Immigrants | Kazakhstan | 74.7 /100 | #155 | Good 95.1% |
| Immigrants | Kenya | 73.1 /100 | #156 | Good 95.0% |
| Mongolians | 73.0 /100 | #157 | Good 95.0% |
| Egyptians | 70.1 /100 | #158 | Good 95.0% |
| Immigrants | Ukraine | 67.4 /100 | #159 | Good 95.0% |
| Immigrants | Italy | 66.6 /100 | #160 | Good 95.0% |
| French American Indians | 66.5 /100 | #161 | Good 95.0% |
| Bermudans | 65.8 /100 | #162 | Good 95.0% |
| Pakistanis | 64.1 /100 | #163 | Good 95.0% |
| Venezuelans | 63.6 /100 | #164 | Good 95.0% |
| Blackfeet | 62.6 /100 | #165 | Good 95.0% |
Demographics Similar to Comanche by 9th Grade
In terms of 9th grade, the demographic groups most similar to Comanche are Immigrants from Pakistan (94.6%, a difference of 0.010%), Immigrants from Morocco (94.6%, a difference of 0.020%), Immigrants from Chile (94.5%, a difference of 0.020%), Samoan (94.6%, a difference of 0.030%), and Immigrants from Sudan (94.6%, a difference of 0.040%).
| Demographics | Rating | Rank | 9th Grade |
| Immigrants | Eastern Asia | 19.8 /100 | #202 | Poor 94.6% |
| Immigrants | Bahamas | 19.8 /100 | #203 | Poor 94.6% |
| Moroccans | 19.6 /100 | #204 | Poor 94.6% |
| Immigrants | Sudan | 17.6 /100 | #205 | Poor 94.6% |
| Samoans | 17.3 /100 | #206 | Poor 94.6% |
| Immigrants | Morocco | 16.3 /100 | #207 | Poor 94.6% |
| Immigrants | Pakistan | 15.5 /100 | #208 | Poor 94.6% |
| Comanche | 14.9 /100 | #209 | Poor 94.6% |
| Immigrants | Chile | 13.4 /100 | #210 | Poor 94.5% |
| Immigrants | Indonesia | 12.3 /100 | #211 | Poor 94.5% |
| Immigrants | Malaysia | 12.2 /100 | #212 | Poor 94.5% |
| Immigrants | Oceania | 12.1 /100 | #213 | Poor 94.5% |
| Immigrants | Liberia | 11.8 /100 | #214 | Poor 94.5% |
| Immigrants | Syria | 11.0 /100 | #215 | Poor 94.5% |
| Immigrants | Western Asia | 10.7 /100 | #216 | Poor 94.5% |