Ecuadorian vs Immigrants from Syria 11th Grade
COMPARE
Ecuadorian
Immigrants from Syria
11th Grade
11th Grade Comparison
Ecuadorians
Immigrants from Syria
89.6%
11TH GRADE
0.0/ 100
METRIC RATING
306th/ 347
METRIC RANK
92.3%
11TH GRADE
30.4/ 100
METRIC RATING
192nd/ 347
METRIC RANK
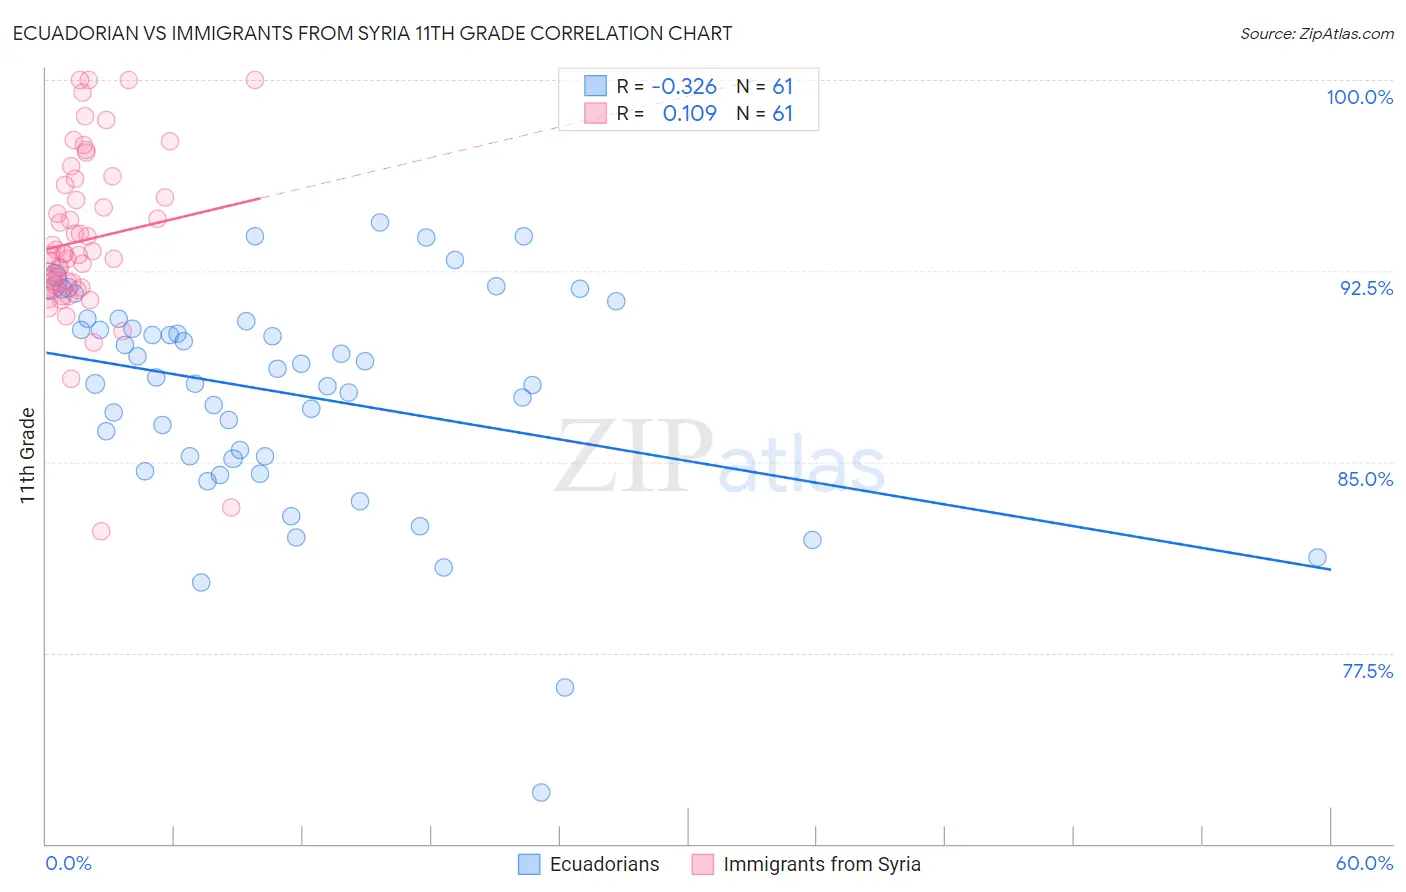
Ecuadorian vs Immigrants from Syria 11th Grade Correlation Chart
The statistical analysis conducted on geographies consisting of 317,753,005 people shows a mild negative correlation between the proportion of Ecuadorians and percentage of population with at least 11th grade education in the United States with a correlation coefficient (R) of -0.326 and weighted average of 89.6%. Similarly, the statistical analysis conducted on geographies consisting of 174,108,882 people shows a poor positive correlation between the proportion of Immigrants from Syria and percentage of population with at least 11th grade education in the United States with a correlation coefficient (R) of 0.109 and weighted average of 92.3%, a difference of 3.1%.
11th Grade Correlation Summary
| Measurement | Ecuadorian | Immigrants from Syria |
| Minimum | 72.0% | 82.3% |
| Maximum | 94.4% | 100.0% |
| Range | 22.4% | 17.7% |
| Mean | 87.7% | 93.7% |
| Median | 88.3% | 93.2% |
| Interquartile 25% (IQ1) | 85.2% | 91.9% |
| Interquartile 75% (IQ3) | 90.6% | 96.0% |
| Interquartile Range (IQR) | 5.4% | 4.1% |
| Standard Deviation (Sample) | 4.3% | 3.5% |
| Standard Deviation (Population) | 4.3% | 3.4% |
Similar Demographics by 11th Grade
Demographics Similar to Ecuadorians by 11th Grade
In terms of 11th grade, the demographic groups most similar to Ecuadorians are Immigrants from Cambodia (89.6%, a difference of 0.050%), Immigrants from Dominica (89.5%, a difference of 0.050%), Nepalese (89.5%, a difference of 0.070%), Immigrants from Bangladesh (89.5%, a difference of 0.10%), and Yaqui (89.5%, a difference of 0.11%).
| Demographics | Rating | Rank | 11th Grade |
| Japanese | 0.0 /100 | #299 | Tragic 89.9% |
| Immigrants | Haiti | 0.0 /100 | #300 | Tragic 89.9% |
| Guyanese | 0.0 /100 | #301 | Tragic 89.9% |
| Immigrants | Guyana | 0.0 /100 | #302 | Tragic 89.7% |
| Immigrants | Immigrants | 0.0 /100 | #303 | Tragic 89.7% |
| Yuman | 0.0 /100 | #304 | Tragic 89.7% |
| Immigrants | Cambodia | 0.0 /100 | #305 | Tragic 89.6% |
| Ecuadorians | 0.0 /100 | #306 | Tragic 89.6% |
| Immigrants | Dominica | 0.0 /100 | #307 | Tragic 89.5% |
| Nepalese | 0.0 /100 | #308 | Tragic 89.5% |
| Immigrants | Bangladesh | 0.0 /100 | #309 | Tragic 89.5% |
| Yaqui | 0.0 /100 | #310 | Tragic 89.5% |
| Vietnamese | 0.0 /100 | #311 | Tragic 89.4% |
| Immigrants | Portugal | 0.0 /100 | #312 | Tragic 89.3% |
| Immigrants | Caribbean | 0.0 /100 | #313 | Tragic 89.1% |
Demographics Similar to Immigrants from Syria by 11th Grade
In terms of 11th grade, the demographic groups most similar to Immigrants from Syria are French American Indian (92.3%, a difference of 0.0%), Chickasaw (92.3%, a difference of 0.010%), Moroccan (92.3%, a difference of 0.020%), Sioux (92.3%, a difference of 0.020%), and Immigrants from Chile (92.4%, a difference of 0.030%).
| Demographics | Rating | Rank | 11th Grade |
| Immigrants | Nepal | 36.4 /100 | #185 | Fair 92.4% |
| Arapaho | 35.1 /100 | #186 | Fair 92.4% |
| Immigrants | Western Asia | 35.0 /100 | #187 | Fair 92.4% |
| Immigrants | Indonesia | 33.7 /100 | #188 | Fair 92.4% |
| Immigrants | Chile | 33.3 /100 | #189 | Fair 92.4% |
| Chickasaw | 31.4 /100 | #190 | Fair 92.3% |
| French American Indians | 30.8 /100 | #191 | Fair 92.3% |
| Immigrants | Syria | 30.4 /100 | #192 | Fair 92.3% |
| Moroccans | 28.7 /100 | #193 | Fair 92.3% |
| Sioux | 28.5 /100 | #194 | Fair 92.3% |
| Liberians | 26.8 /100 | #195 | Fair 92.3% |
| Panamanians | 26.4 /100 | #196 | Fair 92.3% |
| Marshallese | 26.0 /100 | #197 | Fair 92.3% |
| Hawaiians | 25.5 /100 | #198 | Fair 92.3% |
| Immigrants | Uganda | 25.2 /100 | #199 | Fair 92.3% |