Immigrants from Uruguay vs Somali 11th Grade
COMPARE
Immigrants from Uruguay
Somali
11th Grade
11th Grade Comparison
Immigrants from Uruguay
Somalis
91.3%
11TH GRADE
0.5/ 100
METRIC RATING
262nd/ 347
METRIC RANK
92.1%
11TH GRADE
11.6/ 100
METRIC RATING
216th/ 347
METRIC RANK
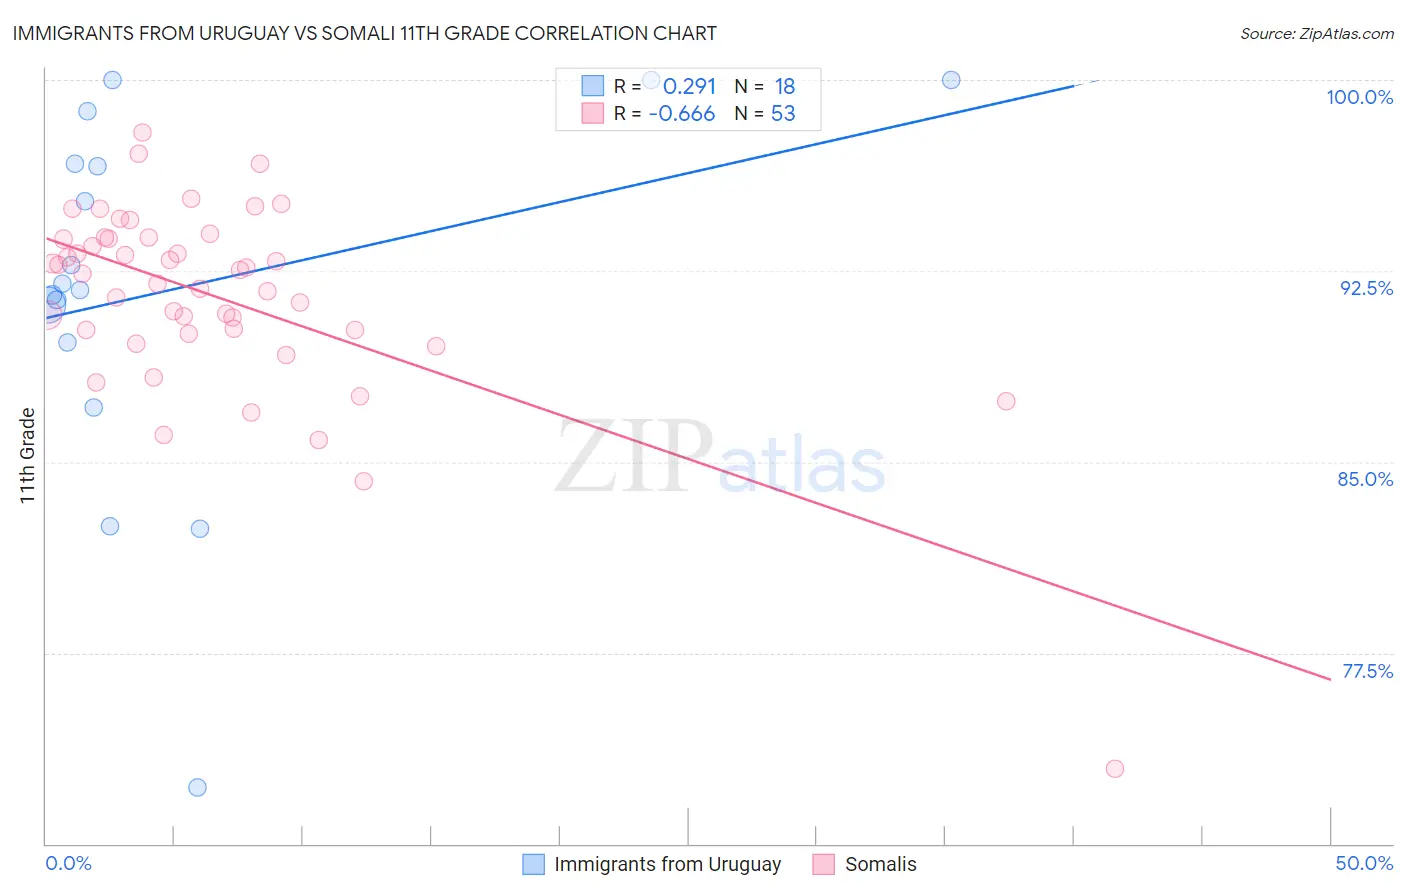
Immigrants from Uruguay vs Somali 11th Grade Correlation Chart
The statistical analysis conducted on geographies consisting of 133,259,667 people shows a weak positive correlation between the proportion of Immigrants from Uruguay and percentage of population with at least 11th grade education in the United States with a correlation coefficient (R) of 0.291 and weighted average of 91.3%. Similarly, the statistical analysis conducted on geographies consisting of 99,330,527 people shows a significant negative correlation between the proportion of Somalis and percentage of population with at least 11th grade education in the United States with a correlation coefficient (R) of -0.666 and weighted average of 92.1%, a difference of 0.79%.
11th Grade Correlation Summary
| Measurement | Immigrants from Uruguay | Somali |
| Minimum | 72.2% | 72.9% |
| Maximum | 100.0% | 98.0% |
| Range | 27.8% | 25.0% |
| Mean | 91.8% | 91.5% |
| Median | 91.9% | 92.4% |
| Interquartile 25% (IQ1) | 89.7% | 90.1% |
| Interquartile 75% (IQ3) | 96.7% | 93.8% |
| Interquartile Range (IQR) | 7.0% | 3.7% |
| Standard Deviation (Sample) | 7.3% | 3.9% |
| Standard Deviation (Population) | 7.1% | 3.9% |
Similar Demographics by 11th Grade
Demographics Similar to Immigrants from Uruguay by 11th Grade
In terms of 11th grade, the demographic groups most similar to Immigrants from Uruguay are Taiwanese (91.3%, a difference of 0.010%), Spanish American (91.4%, a difference of 0.020%), Jamaican (91.4%, a difference of 0.030%), Immigrants from Colombia (91.4%, a difference of 0.040%), and Immigrants from Senegal (91.4%, a difference of 0.060%).
| Demographics | Rating | Rank | 11th Grade |
| Blacks/African Americans | 0.7 /100 | #255 | Tragic 91.4% |
| Immigrants | Senegal | 0.7 /100 | #256 | Tragic 91.4% |
| Cajuns | 0.7 /100 | #257 | Tragic 91.4% |
| Immigrants | Colombia | 0.6 /100 | #258 | Tragic 91.4% |
| Jamaicans | 0.6 /100 | #259 | Tragic 91.4% |
| Spanish Americans | 0.6 /100 | #260 | Tragic 91.4% |
| Taiwanese | 0.6 /100 | #261 | Tragic 91.3% |
| Immigrants | Uruguay | 0.5 /100 | #262 | Tragic 91.3% |
| Immigrants | Ghana | 0.3 /100 | #263 | Tragic 91.2% |
| Yup'ik | 0.3 /100 | #264 | Tragic 91.2% |
| Pueblo | 0.3 /100 | #265 | Tragic 91.2% |
| Immigrants | Western Africa | 0.3 /100 | #266 | Tragic 91.2% |
| Immigrants | Jamaica | 0.3 /100 | #267 | Tragic 91.2% |
| U.S. Virgin Islanders | 0.2 /100 | #268 | Tragic 91.1% |
| Ute | 0.2 /100 | #269 | Tragic 91.1% |
Demographics Similar to Somalis by 11th Grade
In terms of 11th grade, the demographic groups most similar to Somalis are Immigrants from Sierra Leone (92.0%, a difference of 0.010%), Immigrants from Southern Europe (92.1%, a difference of 0.020%), Afghan (92.1%, a difference of 0.030%), Blackfeet (92.0%, a difference of 0.040%), and Portuguese (92.0%, a difference of 0.040%).
| Demographics | Rating | Rank | 11th Grade |
| Tongans | 19.8 /100 | #209 | Poor 92.2% |
| Ethiopians | 18.8 /100 | #210 | Poor 92.2% |
| Immigrants | Micronesia | 17.7 /100 | #211 | Poor 92.2% |
| Koreans | 14.4 /100 | #212 | Poor 92.1% |
| Immigrants | Ethiopia | 13.9 /100 | #213 | Poor 92.1% |
| Afghans | 12.8 /100 | #214 | Poor 92.1% |
| Immigrants | Southern Europe | 12.5 /100 | #215 | Poor 92.1% |
| Somalis | 11.6 /100 | #216 | Poor 92.1% |
| Immigrants | Sierra Leone | 11.1 /100 | #217 | Poor 92.0% |
| Blackfeet | 10.1 /100 | #218 | Poor 92.0% |
| Portuguese | 10.0 /100 | #219 | Tragic 92.0% |
| South American Indians | 7.6 /100 | #220 | Tragic 92.0% |
| Immigrants | Liberia | 7.0 /100 | #221 | Tragic 91.9% |
| Immigrants | Africa | 6.5 /100 | #222 | Tragic 91.9% |
| Immigrants | Bahamas | 6.5 /100 | #223 | Tragic 91.9% |