English vs Somali 11th Grade
COMPARE
English
Somali
11th Grade
11th Grade Comparison
English
Somalis
94.4%
11TH GRADE
100.0/ 100
METRIC RATING
24th/ 347
METRIC RANK
92.1%
11TH GRADE
11.6/ 100
METRIC RATING
216th/ 347
METRIC RANK
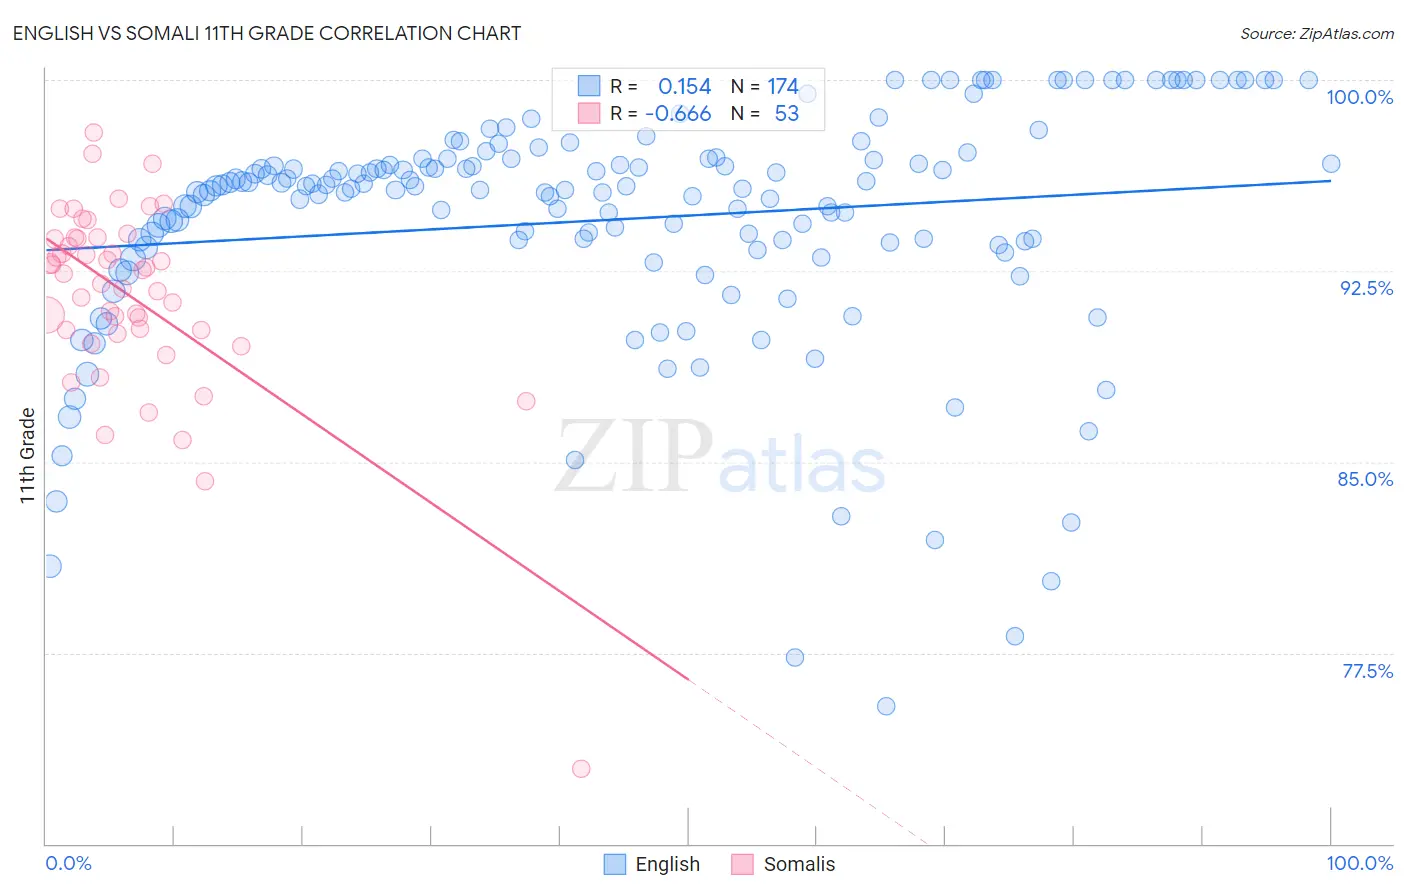
English vs Somali 11th Grade Correlation Chart
The statistical analysis conducted on geographies consisting of 579,980,001 people shows a poor positive correlation between the proportion of English and percentage of population with at least 11th grade education in the United States with a correlation coefficient (R) of 0.154 and weighted average of 94.4%. Similarly, the statistical analysis conducted on geographies consisting of 99,330,527 people shows a significant negative correlation between the proportion of Somalis and percentage of population with at least 11th grade education in the United States with a correlation coefficient (R) of -0.666 and weighted average of 92.1%, a difference of 2.5%.
11th Grade Correlation Summary
| Measurement | English | Somali |
| Minimum | 75.4% | 72.9% |
| Maximum | 100.0% | 98.0% |
| Range | 24.6% | 25.0% |
| Mean | 94.5% | 91.5% |
| Median | 95.7% | 92.4% |
| Interquartile 25% (IQ1) | 93.5% | 90.1% |
| Interquartile 75% (IQ3) | 96.9% | 93.8% |
| Interquartile Range (IQR) | 3.4% | 3.7% |
| Standard Deviation (Sample) | 4.7% | 3.9% |
| Standard Deviation (Population) | 4.7% | 3.9% |
Similar Demographics by 11th Grade
Demographics Similar to English by 11th Grade
In terms of 11th grade, the demographic groups most similar to English are Irish (94.4%, a difference of 0.020%), Scottish (94.4%, a difference of 0.020%), Tsimshian (94.4%, a difference of 0.030%), Czech (94.4%, a difference of 0.030%), and Tlingit-Haida (94.4%, a difference of 0.040%).
| Demographics | Rating | Rank | 11th Grade |
| Luxembourgers | 100.0 /100 | #17 | Exceptional 94.5% |
| Maltese | 100.0 /100 | #18 | Exceptional 94.5% |
| Scandinavians | 100.0 /100 | #19 | Exceptional 94.5% |
| Italians | 100.0 /100 | #20 | Exceptional 94.5% |
| Tlingit-Haida | 100.0 /100 | #21 | Exceptional 94.4% |
| Tsimshian | 100.0 /100 | #22 | Exceptional 94.4% |
| Czechs | 100.0 /100 | #23 | Exceptional 94.4% |
| English | 100.0 /100 | #24 | Exceptional 94.4% |
| Irish | 100.0 /100 | #25 | Exceptional 94.4% |
| Scottish | 100.0 /100 | #26 | Exceptional 94.4% |
| Europeans | 100.0 /100 | #27 | Exceptional 94.4% |
| Estonians | 100.0 /100 | #28 | Exceptional 94.4% |
| Dutch | 100.0 /100 | #29 | Exceptional 94.3% |
| Russians | 100.0 /100 | #30 | Exceptional 94.3% |
| Welsh | 99.9 /100 | #31 | Exceptional 94.2% |
Demographics Similar to Somalis by 11th Grade
In terms of 11th grade, the demographic groups most similar to Somalis are Immigrants from Sierra Leone (92.0%, a difference of 0.010%), Immigrants from Southern Europe (92.1%, a difference of 0.020%), Afghan (92.1%, a difference of 0.030%), Blackfeet (92.0%, a difference of 0.040%), and Portuguese (92.0%, a difference of 0.040%).
| Demographics | Rating | Rank | 11th Grade |
| Tongans | 19.8 /100 | #209 | Poor 92.2% |
| Ethiopians | 18.8 /100 | #210 | Poor 92.2% |
| Immigrants | Micronesia | 17.7 /100 | #211 | Poor 92.2% |
| Koreans | 14.4 /100 | #212 | Poor 92.1% |
| Immigrants | Ethiopia | 13.9 /100 | #213 | Poor 92.1% |
| Afghans | 12.8 /100 | #214 | Poor 92.1% |
| Immigrants | Southern Europe | 12.5 /100 | #215 | Poor 92.1% |
| Somalis | 11.6 /100 | #216 | Poor 92.1% |
| Immigrants | Sierra Leone | 11.1 /100 | #217 | Poor 92.0% |
| Blackfeet | 10.1 /100 | #218 | Poor 92.0% |
| Portuguese | 10.0 /100 | #219 | Tragic 92.0% |
| South American Indians | 7.6 /100 | #220 | Tragic 92.0% |
| Immigrants | Liberia | 7.0 /100 | #221 | Tragic 91.9% |
| Immigrants | Africa | 6.5 /100 | #222 | Tragic 91.9% |
| Immigrants | Bahamas | 6.5 /100 | #223 | Tragic 91.9% |