Ecuadorian vs Immigrants from Moldova 11th Grade
COMPARE
Ecuadorian
Immigrants from Moldova
11th Grade
11th Grade Comparison
Ecuadorians
Immigrants from Moldova
89.6%
11TH GRADE
0.0/ 100
METRIC RATING
306th/ 347
METRIC RANK
93.7%
11TH GRADE
99.5/ 100
METRIC RATING
81st/ 347
METRIC RANK
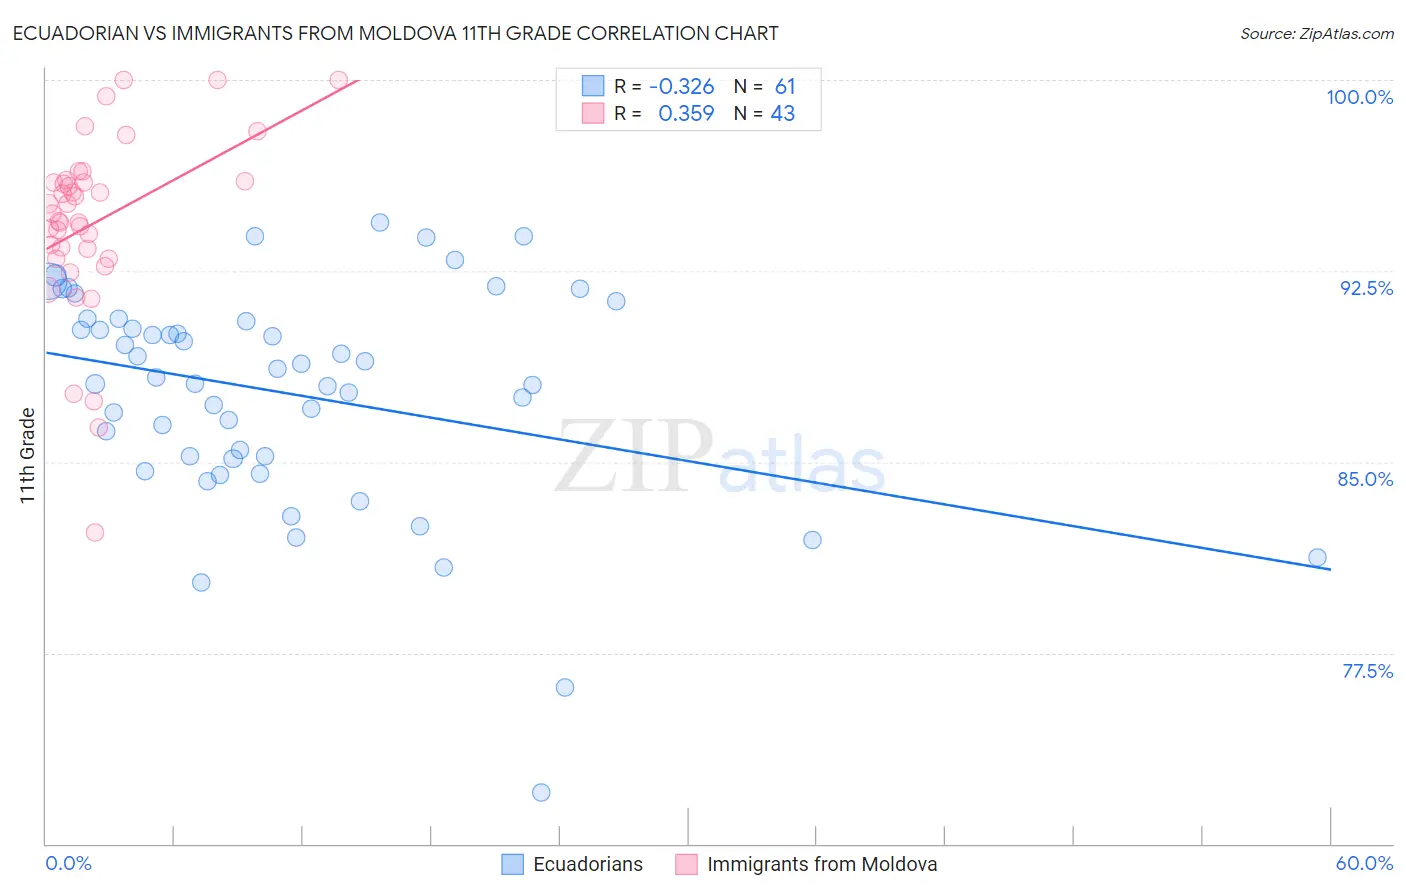
Ecuadorian vs Immigrants from Moldova 11th Grade Correlation Chart
The statistical analysis conducted on geographies consisting of 317,753,005 people shows a mild negative correlation between the proportion of Ecuadorians and percentage of population with at least 11th grade education in the United States with a correlation coefficient (R) of -0.326 and weighted average of 89.6%. Similarly, the statistical analysis conducted on geographies consisting of 124,399,411 people shows a mild positive correlation between the proportion of Immigrants from Moldova and percentage of population with at least 11th grade education in the United States with a correlation coefficient (R) of 0.359 and weighted average of 93.7%, a difference of 4.6%.
11th Grade Correlation Summary
| Measurement | Ecuadorian | Immigrants from Moldova |
| Minimum | 72.0% | 82.2% |
| Maximum | 94.4% | 100.0% |
| Range | 22.4% | 17.8% |
| Mean | 87.7% | 94.4% |
| Median | 88.3% | 94.8% |
| Interquartile 25% (IQ1) | 85.2% | 93.0% |
| Interquartile 75% (IQ3) | 90.6% | 96.0% |
| Interquartile Range (IQR) | 5.4% | 3.0% |
| Standard Deviation (Sample) | 4.3% | 3.6% |
| Standard Deviation (Population) | 4.3% | 3.5% |
Similar Demographics by 11th Grade
Demographics Similar to Ecuadorians by 11th Grade
In terms of 11th grade, the demographic groups most similar to Ecuadorians are Immigrants from Cambodia (89.6%, a difference of 0.050%), Immigrants from Dominica (89.5%, a difference of 0.050%), Nepalese (89.5%, a difference of 0.070%), Immigrants from Bangladesh (89.5%, a difference of 0.10%), and Yaqui (89.5%, a difference of 0.11%).
| Demographics | Rating | Rank | 11th Grade |
| Japanese | 0.0 /100 | #299 | Tragic 89.9% |
| Immigrants | Haiti | 0.0 /100 | #300 | Tragic 89.9% |
| Guyanese | 0.0 /100 | #301 | Tragic 89.9% |
| Immigrants | Guyana | 0.0 /100 | #302 | Tragic 89.7% |
| Immigrants | Immigrants | 0.0 /100 | #303 | Tragic 89.7% |
| Yuman | 0.0 /100 | #304 | Tragic 89.7% |
| Immigrants | Cambodia | 0.0 /100 | #305 | Tragic 89.6% |
| Ecuadorians | 0.0 /100 | #306 | Tragic 89.6% |
| Immigrants | Dominica | 0.0 /100 | #307 | Tragic 89.5% |
| Nepalese | 0.0 /100 | #308 | Tragic 89.5% |
| Immigrants | Bangladesh | 0.0 /100 | #309 | Tragic 89.5% |
| Yaqui | 0.0 /100 | #310 | Tragic 89.5% |
| Vietnamese | 0.0 /100 | #311 | Tragic 89.4% |
| Immigrants | Portugal | 0.0 /100 | #312 | Tragic 89.3% |
| Immigrants | Caribbean | 0.0 /100 | #313 | Tragic 89.1% |
Demographics Similar to Immigrants from Moldova by 11th Grade
In terms of 11th grade, the demographic groups most similar to Immigrants from Moldova are Canadian (93.7%, a difference of 0.0%), Immigrants from Denmark (93.7%, a difference of 0.020%), Aleut (93.7%, a difference of 0.030%), Soviet Union (93.7%, a difference of 0.030%), and Celtic (93.7%, a difference of 0.040%).
| Demographics | Rating | Rank | 11th Grade |
| Immigrants | Czechoslovakia | 99.6 /100 | #74 | Exceptional 93.8% |
| Immigrants | Latvia | 99.6 /100 | #75 | Exceptional 93.8% |
| Celtics | 99.5 /100 | #76 | Exceptional 93.7% |
| Aleuts | 99.5 /100 | #77 | Exceptional 93.7% |
| Soviet Union | 99.5 /100 | #78 | Exceptional 93.7% |
| Immigrants | Denmark | 99.5 /100 | #79 | Exceptional 93.7% |
| Canadians | 99.5 /100 | #80 | Exceptional 93.7% |
| Immigrants | Moldova | 99.5 /100 | #81 | Exceptional 93.7% |
| Immigrants | Saudi Arabia | 99.3 /100 | #82 | Exceptional 93.7% |
| Icelanders | 99.3 /100 | #83 | Exceptional 93.6% |
| Immigrants | Taiwan | 99.3 /100 | #84 | Exceptional 93.6% |
| Immigrants | Switzerland | 99.3 /100 | #85 | Exceptional 93.6% |
| Immigrants | South Central Asia | 99.2 /100 | #86 | Exceptional 93.6% |
| Immigrants | Western Europe | 99.2 /100 | #87 | Exceptional 93.6% |
| Cambodians | 99.2 /100 | #88 | Exceptional 93.6% |