Ecuadorian vs Immigrants from Russia 11th Grade
COMPARE
Ecuadorian
Immigrants from Russia
11th Grade
11th Grade Comparison
Ecuadorians
Immigrants from Russia
89.6%
11TH GRADE
0.0/ 100
METRIC RATING
306th/ 347
METRIC RANK
93.3%
11TH GRADE
96.6/ 100
METRIC RATING
120th/ 347
METRIC RANK
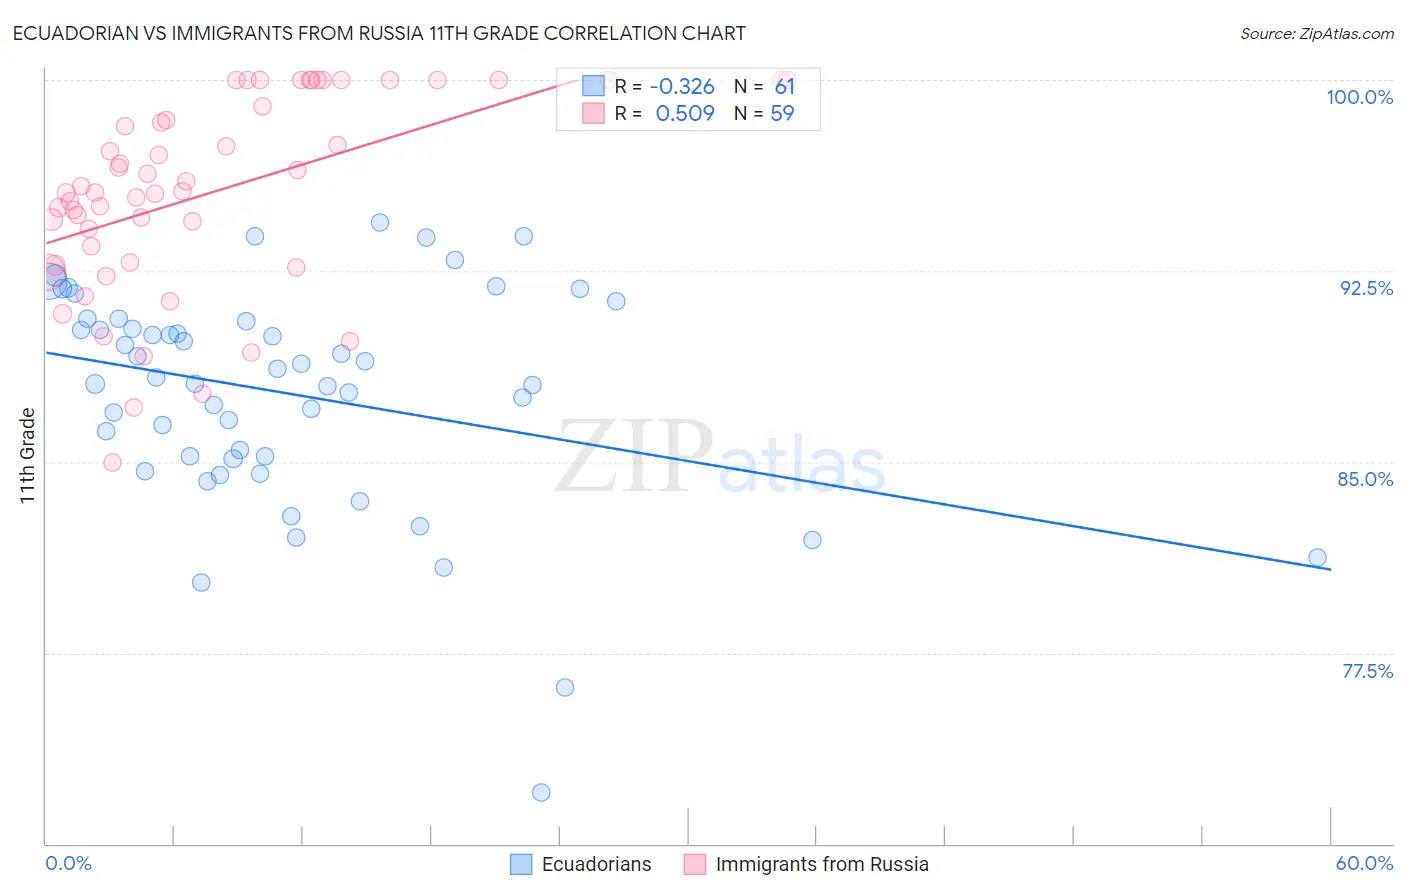
Ecuadorian vs Immigrants from Russia 11th Grade Correlation Chart
The statistical analysis conducted on geographies consisting of 317,753,005 people shows a mild negative correlation between the proportion of Ecuadorians and percentage of population with at least 11th grade education in the United States with a correlation coefficient (R) of -0.326 and weighted average of 89.6%. Similarly, the statistical analysis conducted on geographies consisting of 347,948,494 people shows a substantial positive correlation between the proportion of Immigrants from Russia and percentage of population with at least 11th grade education in the United States with a correlation coefficient (R) of 0.509 and weighted average of 93.3%, a difference of 4.1%.
11th Grade Correlation Summary
| Measurement | Ecuadorian | Immigrants from Russia |
| Minimum | 72.0% | 85.0% |
| Maximum | 94.4% | 100.0% |
| Range | 22.4% | 15.0% |
| Mean | 87.7% | 95.6% |
| Median | 88.3% | 95.7% |
| Interquartile 25% (IQ1) | 85.2% | 92.8% |
| Interquartile 75% (IQ3) | 90.6% | 100.0% |
| Interquartile Range (IQR) | 5.4% | 7.2% |
| Standard Deviation (Sample) | 4.3% | 3.8% |
| Standard Deviation (Population) | 4.3% | 3.8% |
Similar Demographics by 11th Grade
Demographics Similar to Ecuadorians by 11th Grade
In terms of 11th grade, the demographic groups most similar to Ecuadorians are Immigrants from Cambodia (89.6%, a difference of 0.050%), Immigrants from Dominica (89.5%, a difference of 0.050%), Nepalese (89.5%, a difference of 0.070%), Immigrants from Bangladesh (89.5%, a difference of 0.10%), and Yaqui (89.5%, a difference of 0.11%).
| Demographics | Rating | Rank | 11th Grade |
| Japanese | 0.0 /100 | #299 | Tragic 89.9% |
| Immigrants | Haiti | 0.0 /100 | #300 | Tragic 89.9% |
| Guyanese | 0.0 /100 | #301 | Tragic 89.9% |
| Immigrants | Guyana | 0.0 /100 | #302 | Tragic 89.7% |
| Immigrants | Immigrants | 0.0 /100 | #303 | Tragic 89.7% |
| Yuman | 0.0 /100 | #304 | Tragic 89.7% |
| Immigrants | Cambodia | 0.0 /100 | #305 | Tragic 89.6% |
| Ecuadorians | 0.0 /100 | #306 | Tragic 89.6% |
| Immigrants | Dominica | 0.0 /100 | #307 | Tragic 89.5% |
| Nepalese | 0.0 /100 | #308 | Tragic 89.5% |
| Immigrants | Bangladesh | 0.0 /100 | #309 | Tragic 89.5% |
| Yaqui | 0.0 /100 | #310 | Tragic 89.5% |
| Vietnamese | 0.0 /100 | #311 | Tragic 89.4% |
| Immigrants | Portugal | 0.0 /100 | #312 | Tragic 89.3% |
| Immigrants | Caribbean | 0.0 /100 | #313 | Tragic 89.1% |
Demographics Similar to Immigrants from Russia by 11th Grade
In terms of 11th grade, the demographic groups most similar to Immigrants from Russia are German Russian (93.3%, a difference of 0.020%), Immigrants from Belarus (93.3%, a difference of 0.020%), Immigrants from Korea (93.3%, a difference of 0.030%), Israeli (93.3%, a difference of 0.030%), and Immigrants from Greece (93.2%, a difference of 0.050%).
| Demographics | Rating | Rank | 11th Grade |
| Immigrants | Zimbabwe | 97.8 /100 | #113 | Exceptional 93.4% |
| Jordanians | 97.8 /100 | #114 | Exceptional 93.4% |
| Palestinians | 97.7 /100 | #115 | Exceptional 93.4% |
| Immigrants | Hungary | 97.5 /100 | #116 | Exceptional 93.4% |
| Whites/Caucasians | 97.4 /100 | #117 | Exceptional 93.3% |
| Immigrants | Korea | 97.0 /100 | #118 | Exceptional 93.3% |
| Israelis | 97.0 /100 | #119 | Exceptional 93.3% |
| Immigrants | Russia | 96.6 /100 | #120 | Exceptional 93.3% |
| German Russians | 96.4 /100 | #121 | Exceptional 93.3% |
| Immigrants | Belarus | 96.3 /100 | #122 | Exceptional 93.3% |
| Immigrants | Greece | 95.9 /100 | #123 | Exceptional 93.2% |
| Immigrants | Eastern Europe | 95.9 /100 | #124 | Exceptional 93.2% |
| Immigrants | Sri Lanka | 95.6 /100 | #125 | Exceptional 93.2% |
| Basques | 95.2 /100 | #126 | Exceptional 93.2% |
| Immigrants | Kazakhstan | 92.4 /100 | #127 | Exceptional 93.1% |