Ecuadorian vs Polish 9th Grade
COMPARE
Ecuadorian
Polish
9th Grade
9th Grade Comparison
Ecuadorians
Poles
91.9%
9TH GRADE
0.0/ 100
METRIC RATING
319th/ 347
METRIC RANK
96.7%
9TH GRADE
100.0/ 100
METRIC RATING
6th/ 347
METRIC RANK
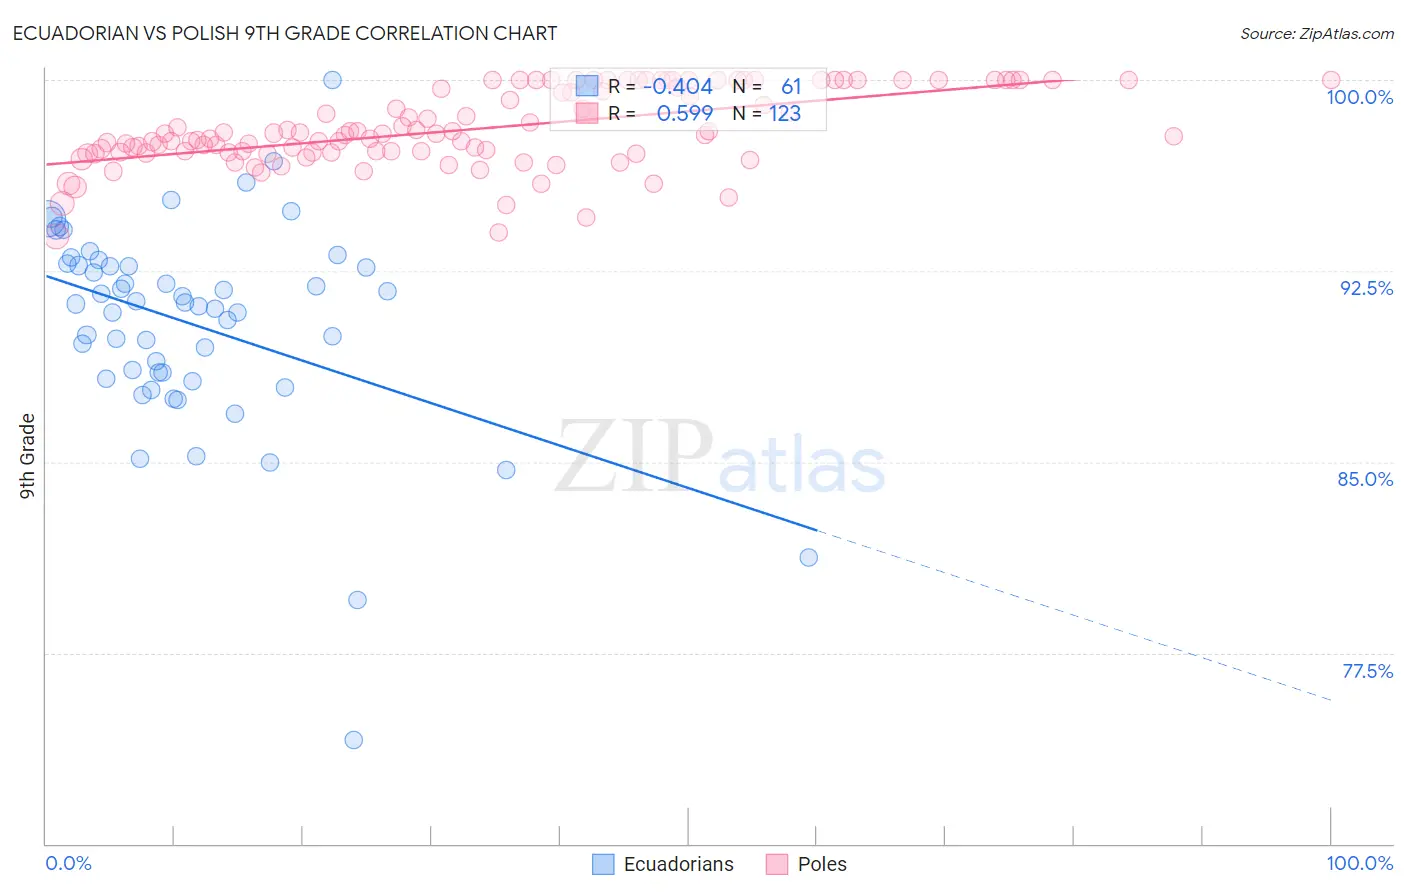
Ecuadorian vs Polish 9th Grade Correlation Chart
The statistical analysis conducted on geographies consisting of 317,864,750 people shows a moderate negative correlation between the proportion of Ecuadorians and percentage of population with at least 9th grade education in the United States with a correlation coefficient (R) of -0.404 and weighted average of 91.9%. Similarly, the statistical analysis conducted on geographies consisting of 475,812,379 people shows a substantial positive correlation between the proportion of Poles and percentage of population with at least 9th grade education in the United States with a correlation coefficient (R) of 0.599 and weighted average of 96.7%, a difference of 5.2%.
9th Grade Correlation Summary
| Measurement | Ecuadorian | Polish |
| Minimum | 74.1% | 93.8% |
| Maximum | 100.0% | 100.0% |
| Range | 25.9% | 6.2% |
| Mean | 90.4% | 98.1% |
| Median | 91.2% | 97.8% |
| Interquartile 25% (IQ1) | 88.4% | 97.2% |
| Interquartile 75% (IQ3) | 92.8% | 100.0% |
| Interquartile Range (IQR) | 4.4% | 2.8% |
| Standard Deviation (Sample) | 4.1% | 1.5% |
| Standard Deviation (Population) | 4.1% | 1.5% |
Similar Demographics by 9th Grade
Demographics Similar to Ecuadorians by 9th Grade
In terms of 9th grade, the demographic groups most similar to Ecuadorians are Nicaraguan (91.9%, a difference of 0.040%), Nepalese (92.0%, a difference of 0.050%), Immigrants from Ecuador (91.8%, a difference of 0.11%), Belizean (91.8%, a difference of 0.13%), and Puerto Rican (91.8%, a difference of 0.14%).
| Demographics | Rating | Rank | 9th Grade |
| Houma | 0.0 /100 | #312 | Tragic 92.3% |
| Vietnamese | 0.0 /100 | #313 | Tragic 92.3% |
| Immigrants | Portugal | 0.0 /100 | #314 | Tragic 92.2% |
| Immigrants | Caribbean | 0.0 /100 | #315 | Tragic 92.2% |
| Cape Verdeans | 0.0 /100 | #316 | Tragic 92.2% |
| Immigrants | Cuba | 0.0 /100 | #317 | Tragic 92.2% |
| Nepalese | 0.0 /100 | #318 | Tragic 92.0% |
| Ecuadorians | 0.0 /100 | #319 | Tragic 91.9% |
| Nicaraguans | 0.0 /100 | #320 | Tragic 91.9% |
| Immigrants | Ecuador | 0.0 /100 | #321 | Tragic 91.8% |
| Belizeans | 0.0 /100 | #322 | Tragic 91.8% |
| Puerto Ricans | 0.0 /100 | #323 | Tragic 91.8% |
| Immigrants | Belize | 0.0 /100 | #324 | Tragic 91.8% |
| Central American Indians | 0.0 /100 | #325 | Tragic 91.5% |
| Immigrants | Armenia | 0.0 /100 | #326 | Tragic 91.4% |
Demographics Similar to Poles by 9th Grade
In terms of 9th grade, the demographic groups most similar to Poles are Swedish (96.7%, a difference of 0.010%), Carpatho Rusyn (96.7%, a difference of 0.010%), Slovene (96.7%, a difference of 0.020%), German (96.7%, a difference of 0.020%), and Tlingit-Haida (96.6%, a difference of 0.10%).
| Demographics | Rating | Rank | 9th Grade |
| Tsimshian | 100.0 /100 | #1 | Exceptional 97.0% |
| Norwegians | 100.0 /100 | #2 | Exceptional 96.9% |
| Slovaks | 100.0 /100 | #3 | Exceptional 96.9% |
| Slovenes | 100.0 /100 | #4 | Exceptional 96.7% |
| Swedes | 100.0 /100 | #5 | Exceptional 96.7% |
| Poles | 100.0 /100 | #6 | Exceptional 96.7% |
| Carpatho Rusyns | 100.0 /100 | #7 | Exceptional 96.7% |
| Germans | 100.0 /100 | #8 | Exceptional 96.7% |
| Tlingit-Haida | 100.0 /100 | #9 | Exceptional 96.6% |
| Lithuanians | 100.0 /100 | #10 | Exceptional 96.6% |
| Finns | 100.0 /100 | #11 | Exceptional 96.6% |
| English | 100.0 /100 | #12 | Exceptional 96.6% |
| Danes | 100.0 /100 | #13 | Exceptional 96.5% |
| Scottish | 100.0 /100 | #14 | Exceptional 96.5% |
| Irish | 100.0 /100 | #15 | Exceptional 96.5% |