Ecuadorian vs Immigrants from Ghana 9th Grade
COMPARE
Ecuadorian
Immigrants from Ghana
9th Grade
9th Grade Comparison
Ecuadorians
Immigrants from Ghana
91.9%
9TH GRADE
0.0/ 100
METRIC RATING
319th/ 347
METRIC RANK
93.8%
9TH GRADE
0.2/ 100
METRIC RATING
271st/ 347
METRIC RANK
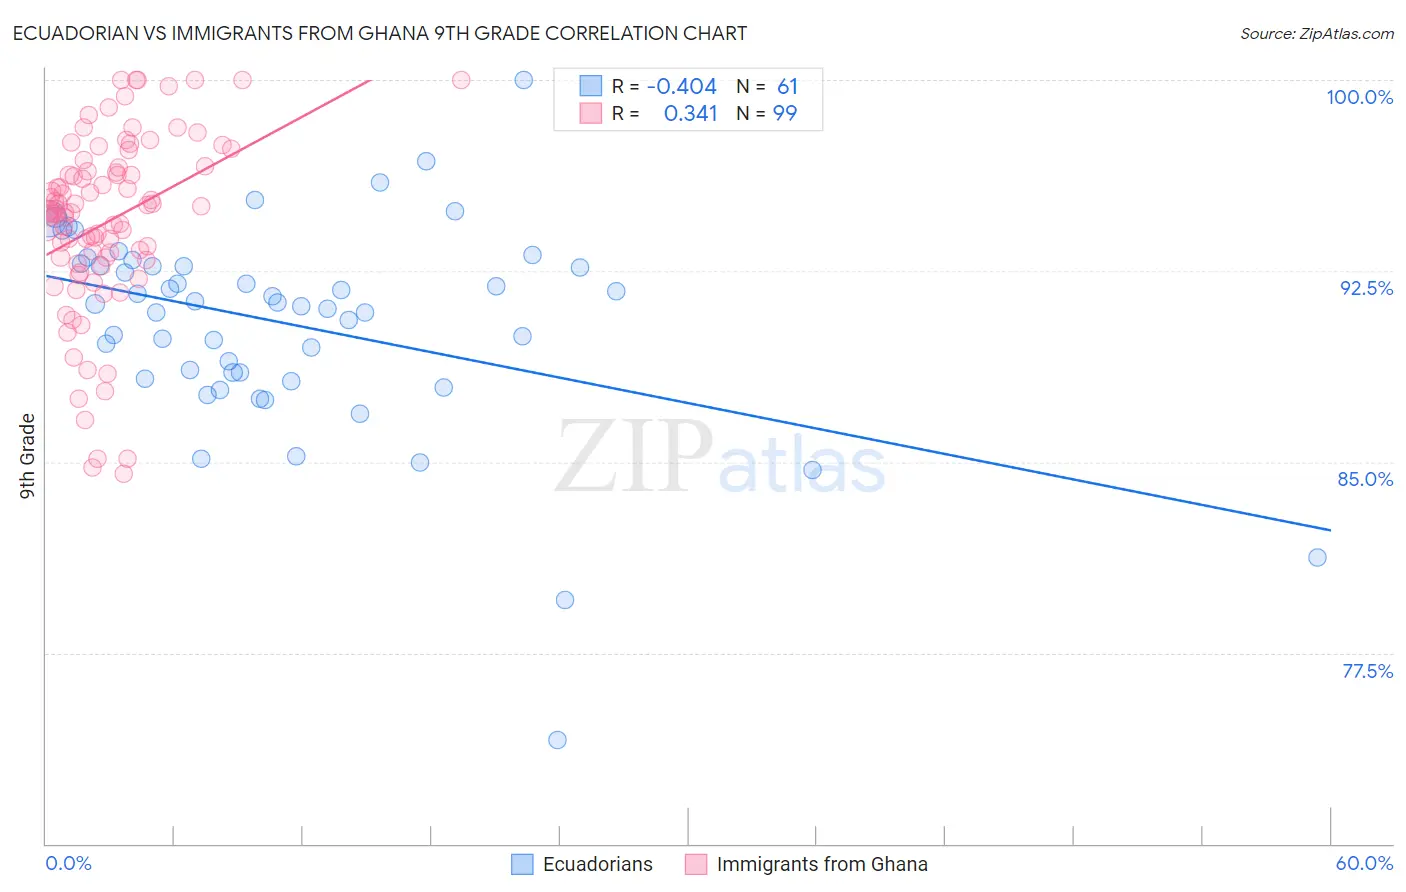
Ecuadorian vs Immigrants from Ghana 9th Grade Correlation Chart
The statistical analysis conducted on geographies consisting of 317,864,750 people shows a moderate negative correlation between the proportion of Ecuadorians and percentage of population with at least 9th grade education in the United States with a correlation coefficient (R) of -0.404 and weighted average of 91.9%. Similarly, the statistical analysis conducted on geographies consisting of 199,952,023 people shows a mild positive correlation between the proportion of Immigrants from Ghana and percentage of population with at least 9th grade education in the United States with a correlation coefficient (R) of 0.341 and weighted average of 93.8%, a difference of 2.0%.
9th Grade Correlation Summary
| Measurement | Ecuadorian | Immigrants from Ghana |
| Minimum | 74.1% | 84.5% |
| Maximum | 100.0% | 100.0% |
| Range | 25.9% | 15.5% |
| Mean | 90.4% | 94.4% |
| Median | 91.2% | 94.8% |
| Interquartile 25% (IQ1) | 88.4% | 92.9% |
| Interquartile 75% (IQ3) | 92.8% | 96.6% |
| Interquartile Range (IQR) | 4.4% | 3.6% |
| Standard Deviation (Sample) | 4.1% | 3.5% |
| Standard Deviation (Population) | 4.1% | 3.5% |
Similar Demographics by 9th Grade
Demographics Similar to Ecuadorians by 9th Grade
In terms of 9th grade, the demographic groups most similar to Ecuadorians are Nicaraguan (91.9%, a difference of 0.040%), Nepalese (92.0%, a difference of 0.050%), Immigrants from Ecuador (91.8%, a difference of 0.11%), Belizean (91.8%, a difference of 0.13%), and Puerto Rican (91.8%, a difference of 0.14%).
| Demographics | Rating | Rank | 9th Grade |
| Houma | 0.0 /100 | #312 | Tragic 92.3% |
| Vietnamese | 0.0 /100 | #313 | Tragic 92.3% |
| Immigrants | Portugal | 0.0 /100 | #314 | Tragic 92.2% |
| Immigrants | Caribbean | 0.0 /100 | #315 | Tragic 92.2% |
| Cape Verdeans | 0.0 /100 | #316 | Tragic 92.2% |
| Immigrants | Cuba | 0.0 /100 | #317 | Tragic 92.2% |
| Nepalese | 0.0 /100 | #318 | Tragic 92.0% |
| Ecuadorians | 0.0 /100 | #319 | Tragic 91.9% |
| Nicaraguans | 0.0 /100 | #320 | Tragic 91.9% |
| Immigrants | Ecuador | 0.0 /100 | #321 | Tragic 91.8% |
| Belizeans | 0.0 /100 | #322 | Tragic 91.8% |
| Puerto Ricans | 0.0 /100 | #323 | Tragic 91.8% |
| Immigrants | Belize | 0.0 /100 | #324 | Tragic 91.8% |
| Central American Indians | 0.0 /100 | #325 | Tragic 91.5% |
| Immigrants | Armenia | 0.0 /100 | #326 | Tragic 91.4% |
Demographics Similar to Immigrants from Ghana by 9th Grade
In terms of 9th grade, the demographic groups most similar to Immigrants from Ghana are Immigrants from Western Africa (93.8%, a difference of 0.010%), Yuman (93.8%, a difference of 0.020%), Immigrants from South America (93.8%, a difference of 0.020%), Peruvian (93.8%, a difference of 0.020%), and Immigrants from Uruguay (93.8%, a difference of 0.030%).
| Demographics | Rating | Rank | 9th Grade |
| Immigrants | Congo | 0.4 /100 | #264 | Tragic 93.9% |
| Natives/Alaskans | 0.4 /100 | #265 | Tragic 93.9% |
| Navajo | 0.3 /100 | #266 | Tragic 93.9% |
| Armenians | 0.3 /100 | #267 | Tragic 93.9% |
| Immigrants | Bolivia | 0.3 /100 | #268 | Tragic 93.9% |
| Immigrants | Uruguay | 0.2 /100 | #269 | Tragic 93.8% |
| Yuman | 0.2 /100 | #270 | Tragic 93.8% |
| Immigrants | Ghana | 0.2 /100 | #271 | Tragic 93.8% |
| Immigrants | Western Africa | 0.2 /100 | #272 | Tragic 93.8% |
| Immigrants | South America | 0.2 /100 | #273 | Tragic 93.8% |
| Peruvians | 0.2 /100 | #274 | Tragic 93.8% |
| Immigrants | Colombia | 0.2 /100 | #275 | Tragic 93.8% |
| West Indians | 0.2 /100 | #276 | Tragic 93.7% |
| Immigrants | Philippines | 0.1 /100 | #277 | Tragic 93.7% |
| Immigrants | Eritrea | 0.1 /100 | #278 | Tragic 93.7% |