Immigrants from Korea vs Polish 9th Grade
COMPARE
Immigrants from Korea
Polish
9th Grade
9th Grade Comparison
Immigrants from Korea
Poles
95.1%
9TH GRADE
79.6/ 100
METRIC RATING
149th/ 347
METRIC RANK
96.7%
9TH GRADE
100.0/ 100
METRIC RATING
6th/ 347
METRIC RANK
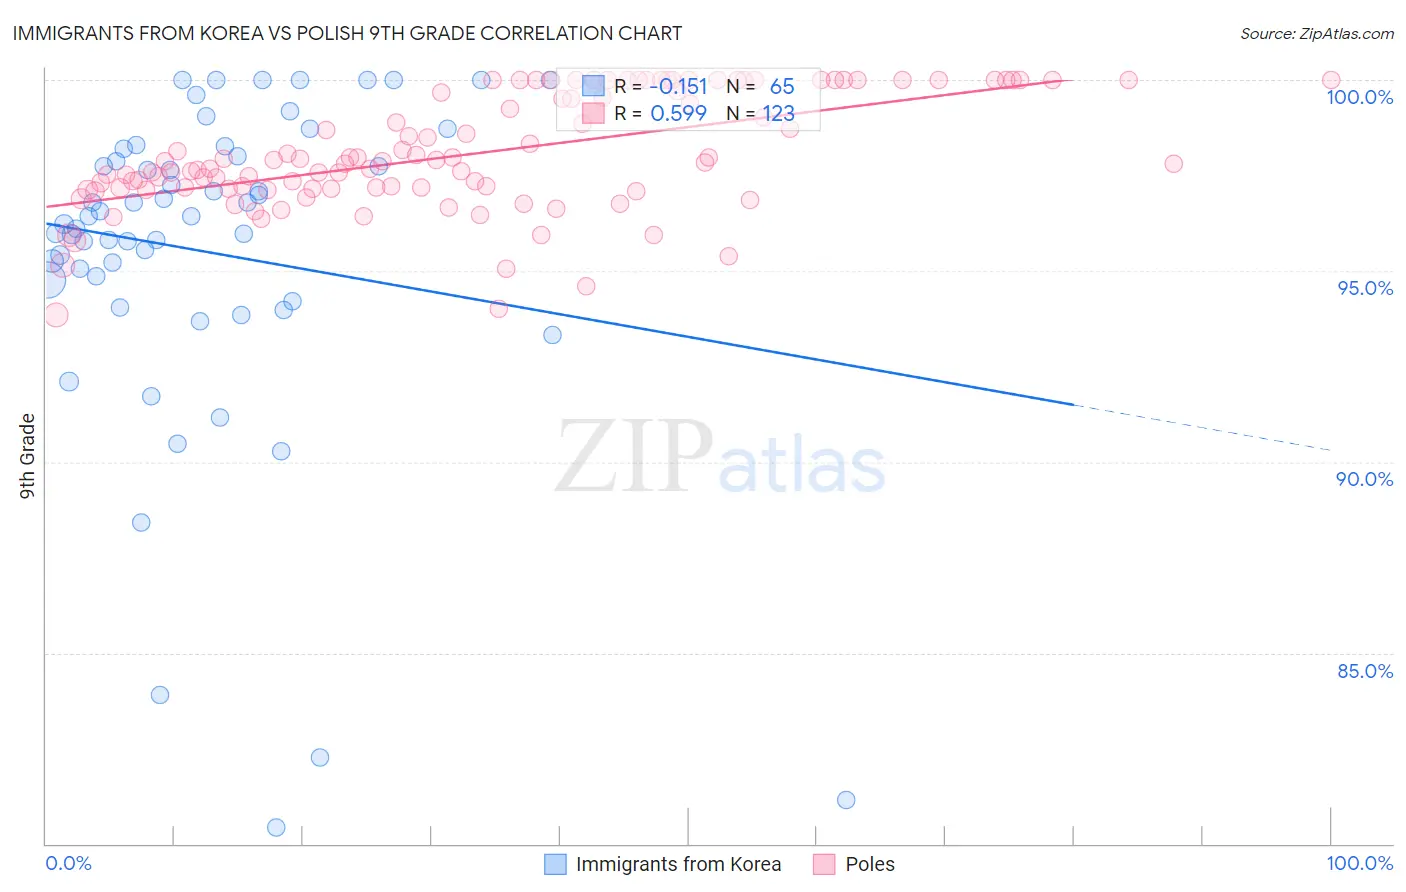
Immigrants from Korea vs Polish 9th Grade Correlation Chart
The statistical analysis conducted on geographies consisting of 416,280,217 people shows a poor negative correlation between the proportion of Immigrants from Korea and percentage of population with at least 9th grade education in the United States with a correlation coefficient (R) of -0.151 and weighted average of 95.1%. Similarly, the statistical analysis conducted on geographies consisting of 475,812,379 people shows a substantial positive correlation between the proportion of Poles and percentage of population with at least 9th grade education in the United States with a correlation coefficient (R) of 0.599 and weighted average of 96.7%, a difference of 1.7%.
9th Grade Correlation Summary
| Measurement | Immigrants from Korea | Polish |
| Minimum | 80.4% | 93.8% |
| Maximum | 100.0% | 100.0% |
| Range | 19.6% | 6.2% |
| Mean | 95.5% | 98.1% |
| Median | 96.4% | 97.8% |
| Interquartile 25% (IQ1) | 94.5% | 97.2% |
| Interquartile 75% (IQ3) | 98.1% | 100.0% |
| Interquartile Range (IQR) | 3.6% | 2.8% |
| Standard Deviation (Sample) | 4.4% | 1.5% |
| Standard Deviation (Population) | 4.3% | 1.5% |
Similar Demographics by 9th Grade
Demographics Similar to Immigrants from Korea by 9th Grade
In terms of 9th grade, the demographic groups most similar to Immigrants from Korea are Kenyan (95.1%, a difference of 0.010%), Immigrants from Jordan (95.1%, a difference of 0.020%), Cajun (95.1%, a difference of 0.020%), Pueblo (95.1%, a difference of 0.030%), and Immigrants from Sri Lanka (95.1%, a difference of 0.030%).
| Demographics | Rating | Rank | 9th Grade |
| Immigrants | Greece | 84.6 /100 | #142 | Excellent 95.2% |
| Spanish | 84.4 /100 | #143 | Excellent 95.2% |
| Yup'ik | 83.3 /100 | #144 | Excellent 95.2% |
| Pueblo | 82.2 /100 | #145 | Excellent 95.1% |
| Immigrants | Sri Lanka | 82.1 /100 | #146 | Excellent 95.1% |
| Choctaw | 81.9 /100 | #147 | Excellent 95.1% |
| Immigrants | Jordan | 81.2 /100 | #148 | Excellent 95.1% |
| Immigrants | Korea | 79.6 /100 | #149 | Good 95.1% |
| Kenyans | 79.1 /100 | #150 | Good 95.1% |
| Cajuns | 77.3 /100 | #151 | Good 95.1% |
| Ugandans | 77.0 /100 | #152 | Good 95.1% |
| Albanians | 76.1 /100 | #153 | Good 95.1% |
| Arabs | 74.9 /100 | #154 | Good 95.1% |
| Immigrants | Kazakhstan | 74.7 /100 | #155 | Good 95.1% |
| Immigrants | Kenya | 73.1 /100 | #156 | Good 95.0% |
Demographics Similar to Poles by 9th Grade
In terms of 9th grade, the demographic groups most similar to Poles are Swedish (96.7%, a difference of 0.010%), Carpatho Rusyn (96.7%, a difference of 0.010%), Slovene (96.7%, a difference of 0.020%), German (96.7%, a difference of 0.020%), and Tlingit-Haida (96.6%, a difference of 0.10%).
| Demographics | Rating | Rank | 9th Grade |
| Tsimshian | 100.0 /100 | #1 | Exceptional 97.0% |
| Norwegians | 100.0 /100 | #2 | Exceptional 96.9% |
| Slovaks | 100.0 /100 | #3 | Exceptional 96.9% |
| Slovenes | 100.0 /100 | #4 | Exceptional 96.7% |
| Swedes | 100.0 /100 | #5 | Exceptional 96.7% |
| Poles | 100.0 /100 | #6 | Exceptional 96.7% |
| Carpatho Rusyns | 100.0 /100 | #7 | Exceptional 96.7% |
| Germans | 100.0 /100 | #8 | Exceptional 96.7% |
| Tlingit-Haida | 100.0 /100 | #9 | Exceptional 96.6% |
| Lithuanians | 100.0 /100 | #10 | Exceptional 96.6% |
| Finns | 100.0 /100 | #11 | Exceptional 96.6% |
| English | 100.0 /100 | #12 | Exceptional 96.6% |
| Danes | 100.0 /100 | #13 | Exceptional 96.5% |
| Scottish | 100.0 /100 | #14 | Exceptional 96.5% |
| Irish | 100.0 /100 | #15 | Exceptional 96.5% |