Ecuadorian vs Bahamian 9th Grade
COMPARE
Ecuadorian
Bahamian
9th Grade
9th Grade Comparison
Ecuadorians
Bahamians
91.9%
9TH GRADE
0.0/ 100
METRIC RATING
319th/ 347
METRIC RANK
94.4%
9TH GRADE
7.0/ 100
METRIC RATING
223rd/ 347
METRIC RANK
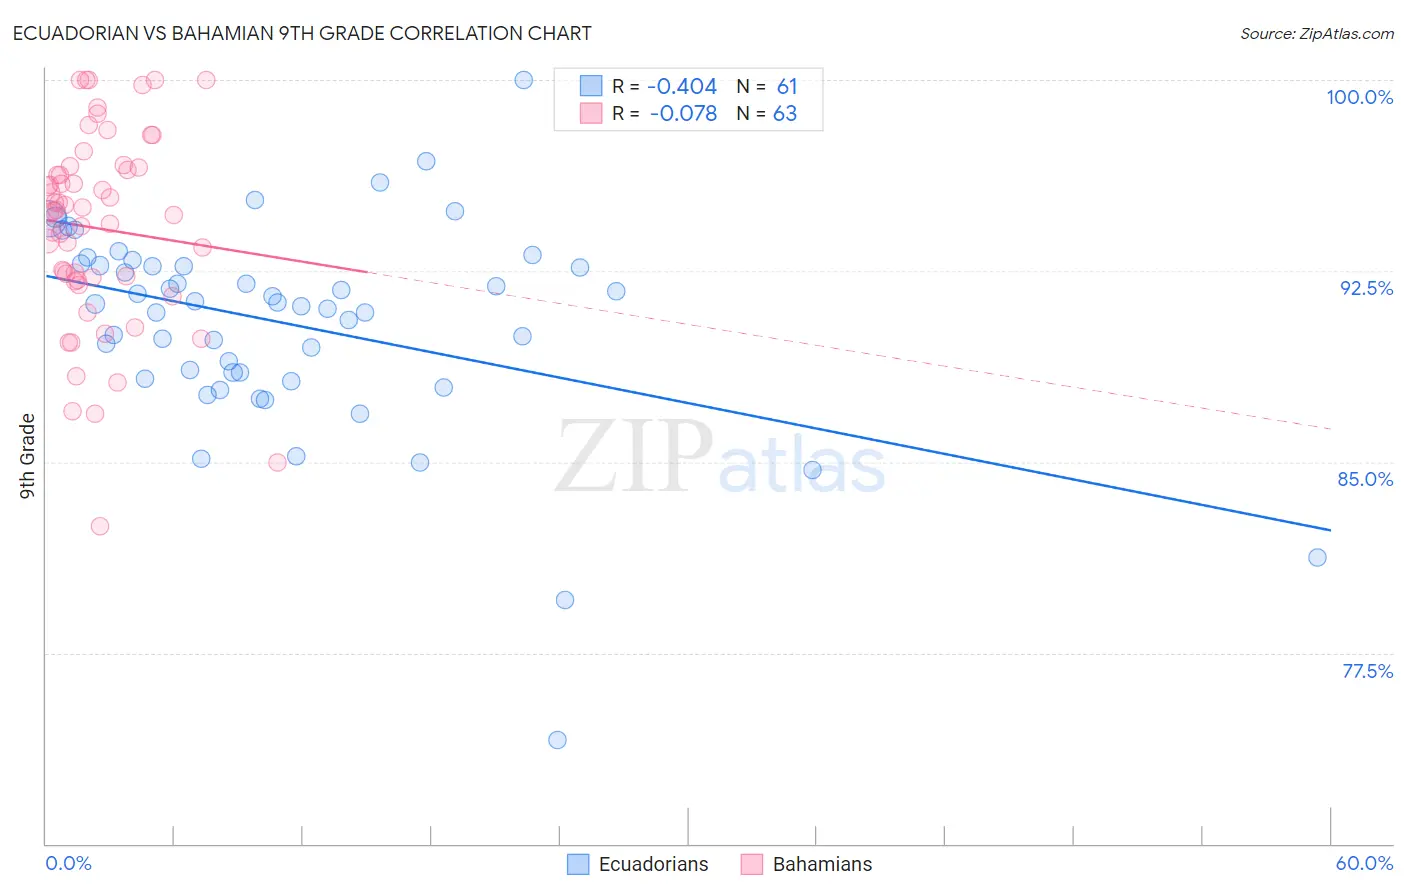
Ecuadorian vs Bahamian 9th Grade Correlation Chart
The statistical analysis conducted on geographies consisting of 317,864,750 people shows a moderate negative correlation between the proportion of Ecuadorians and percentage of population with at least 9th grade education in the United States with a correlation coefficient (R) of -0.404 and weighted average of 91.9%. Similarly, the statistical analysis conducted on geographies consisting of 112,698,819 people shows a slight negative correlation between the proportion of Bahamians and percentage of population with at least 9th grade education in the United States with a correlation coefficient (R) of -0.078 and weighted average of 94.4%, a difference of 2.7%.
9th Grade Correlation Summary
| Measurement | Ecuadorian | Bahamian |
| Minimum | 74.1% | 82.5% |
| Maximum | 100.0% | 100.0% |
| Range | 25.9% | 17.5% |
| Mean | 90.4% | 94.2% |
| Median | 91.2% | 94.8% |
| Interquartile 25% (IQ1) | 88.4% | 92.1% |
| Interquartile 75% (IQ3) | 92.8% | 96.6% |
| Interquartile Range (IQR) | 4.4% | 4.4% |
| Standard Deviation (Sample) | 4.1% | 3.8% |
| Standard Deviation (Population) | 4.1% | 3.8% |
Similar Demographics by 9th Grade
Demographics Similar to Ecuadorians by 9th Grade
In terms of 9th grade, the demographic groups most similar to Ecuadorians are Nicaraguan (91.9%, a difference of 0.040%), Nepalese (92.0%, a difference of 0.050%), Immigrants from Ecuador (91.8%, a difference of 0.11%), Belizean (91.8%, a difference of 0.13%), and Puerto Rican (91.8%, a difference of 0.14%).
| Demographics | Rating | Rank | 9th Grade |
| Houma | 0.0 /100 | #312 | Tragic 92.3% |
| Vietnamese | 0.0 /100 | #313 | Tragic 92.3% |
| Immigrants | Portugal | 0.0 /100 | #314 | Tragic 92.2% |
| Immigrants | Caribbean | 0.0 /100 | #315 | Tragic 92.2% |
| Cape Verdeans | 0.0 /100 | #316 | Tragic 92.2% |
| Immigrants | Cuba | 0.0 /100 | #317 | Tragic 92.2% |
| Nepalese | 0.0 /100 | #318 | Tragic 92.0% |
| Ecuadorians | 0.0 /100 | #319 | Tragic 91.9% |
| Nicaraguans | 0.0 /100 | #320 | Tragic 91.9% |
| Immigrants | Ecuador | 0.0 /100 | #321 | Tragic 91.8% |
| Belizeans | 0.0 /100 | #322 | Tragic 91.8% |
| Puerto Ricans | 0.0 /100 | #323 | Tragic 91.8% |
| Immigrants | Belize | 0.0 /100 | #324 | Tragic 91.8% |
| Central American Indians | 0.0 /100 | #325 | Tragic 91.5% |
| Immigrants | Armenia | 0.0 /100 | #326 | Tragic 91.4% |
Demographics Similar to Bahamians by 9th Grade
In terms of 9th grade, the demographic groups most similar to Bahamians are Immigrants from Asia (94.4%, a difference of 0.020%), Immigrants from Eastern Africa (94.5%, a difference of 0.030%), Tongan (94.4%, a difference of 0.030%), Indian (Asian) (94.5%, a difference of 0.040%), and Portuguese (94.5%, a difference of 0.050%).
| Demographics | Rating | Rank | 9th Grade |
| Immigrants | Western Asia | 10.7 /100 | #216 | Poor 94.5% |
| Asians | 9.9 /100 | #217 | Tragic 94.5% |
| Portuguese | 9.2 /100 | #218 | Tragic 94.5% |
| Africans | 9.0 /100 | #219 | Tragic 94.5% |
| Indians (Asian) | 8.6 /100 | #220 | Tragic 94.5% |
| Immigrants | Eastern Africa | 8.2 /100 | #221 | Tragic 94.5% |
| Immigrants | Asia | 7.7 /100 | #222 | Tragic 94.4% |
| Bahamians | 7.0 /100 | #223 | Tragic 94.4% |
| Tongans | 6.0 /100 | #224 | Tragic 94.4% |
| Ethiopians | 5.4 /100 | #225 | Tragic 94.4% |
| Sub-Saharan Africans | 5.4 /100 | #226 | Tragic 94.4% |
| Immigrants | Sierra Leone | 4.8 /100 | #227 | Tragic 94.4% |
| Lumbee | 4.7 /100 | #228 | Tragic 94.4% |
| Immigrants | Southern Europe | 4.5 /100 | #229 | Tragic 94.3% |
| Apache | 4.2 /100 | #230 | Tragic 94.3% |