Ecuadorian vs Immigrants from Caribbean Master's Degree
COMPARE
Ecuadorian
Immigrants from Caribbean
Master's Degree
Master's Degree Comparison
Ecuadorians
Immigrants from Caribbean
14.0%
MASTER'S DEGREE
12.6/ 100
METRIC RATING
222nd/ 347
METRIC RANK
12.1%
MASTER'S DEGREE
0.3/ 100
METRIC RATING
277th/ 347
METRIC RANK
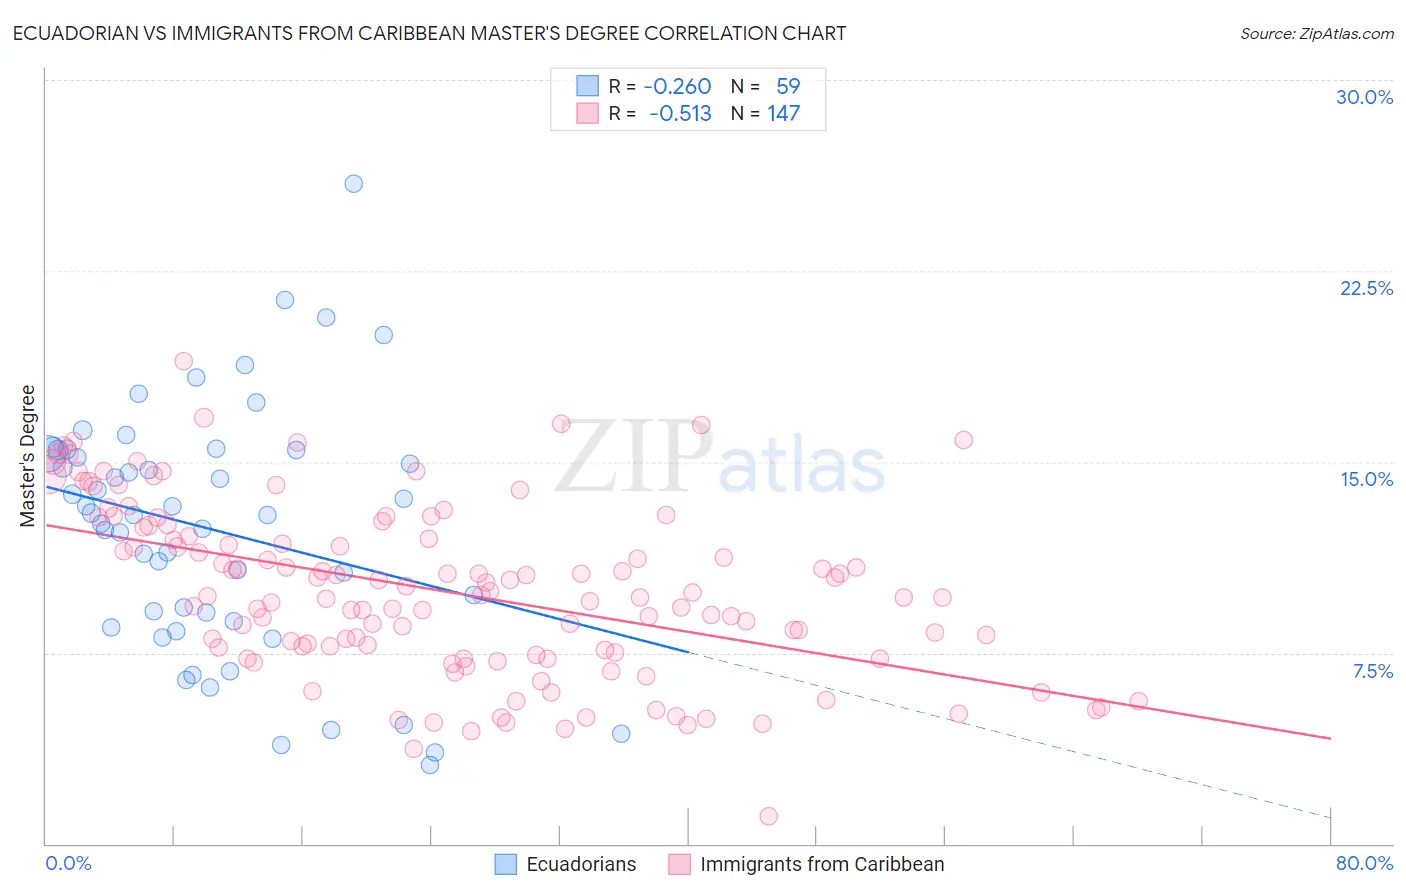
Ecuadorian vs Immigrants from Caribbean Master's Degree Correlation Chart
The statistical analysis conducted on geographies consisting of 317,754,376 people shows a weak negative correlation between the proportion of Ecuadorians and percentage of population with at least master's degree education in the United States with a correlation coefficient (R) of -0.260 and weighted average of 14.0%. Similarly, the statistical analysis conducted on geographies consisting of 449,853,344 people shows a substantial negative correlation between the proportion of Immigrants from Caribbean and percentage of population with at least master's degree education in the United States with a correlation coefficient (R) of -0.513 and weighted average of 12.1%, a difference of 16.0%.
Master's Degree Correlation Summary
| Measurement | Ecuadorian | Immigrants from Caribbean |
| Minimum | 3.1% | 1.1% |
| Maximum | 25.9% | 18.9% |
| Range | 22.8% | 17.8% |
| Mean | 12.3% | 9.9% |
| Median | 12.9% | 9.7% |
| Interquartile 25% (IQ1) | 8.8% | 7.5% |
| Interquartile 75% (IQ3) | 15.5% | 12.4% |
| Interquartile Range (IQR) | 6.7% | 4.9% |
| Standard Deviation (Sample) | 4.8% | 3.3% |
| Standard Deviation (Population) | 4.8% | 3.3% |
Similar Demographics by Master's Degree
Demographics Similar to Ecuadorians by Master's Degree
In terms of master's degree, the demographic groups most similar to Ecuadorians are Korean (14.0%, a difference of 0.030%), German (14.0%, a difference of 0.17%), Immigrants from South Eastern Asia (14.0%, a difference of 0.20%), Immigrants from Grenada (14.0%, a difference of 0.25%), and Norwegian (14.0%, a difference of 0.32%).
| Demographics | Rating | Rank | Master's Degree |
| Immigrants | Vietnam | 16.1 /100 | #215 | Poor 14.1% |
| Immigrants | Somalia | 15.8 /100 | #216 | Poor 14.1% |
| Immigrants | Trinidad and Tobago | 15.8 /100 | #217 | Poor 14.1% |
| French Canadians | 14.9 /100 | #218 | Poor 14.1% |
| Norwegians | 13.6 /100 | #219 | Poor 14.0% |
| Germans | 13.1 /100 | #220 | Poor 14.0% |
| Koreans | 12.7 /100 | #221 | Poor 14.0% |
| Ecuadorians | 12.6 /100 | #222 | Poor 14.0% |
| Immigrants | South Eastern Asia | 11.9 /100 | #223 | Poor 14.0% |
| Immigrants | Grenada | 11.8 /100 | #224 | Poor 14.0% |
| Portuguese | 11.2 /100 | #225 | Poor 13.9% |
| Immigrants | St. Vincent and the Grenadines | 11.0 /100 | #226 | Poor 13.9% |
| Immigrants | West Indies | 9.8 /100 | #227 | Tragic 13.9% |
| Whites/Caucasians | 9.1 /100 | #228 | Tragic 13.8% |
| British West Indians | 8.8 /100 | #229 | Tragic 13.8% |
Demographics Similar to Immigrants from Caribbean by Master's Degree
In terms of master's degree, the demographic groups most similar to Immigrants from Caribbean are Potawatomi (12.1%, a difference of 0.0%), Black/African American (12.1%, a difference of 0.010%), Cuban (12.1%, a difference of 0.060%), Cape Verdean (12.1%, a difference of 0.080%), and Immigrants from Belize (12.1%, a difference of 0.080%).
| Demographics | Rating | Rank | Master's Degree |
| Salvadorans | 0.3 /100 | #270 | Tragic 12.2% |
| Haitians | 0.3 /100 | #271 | Tragic 12.1% |
| Comanche | 0.3 /100 | #272 | Tragic 12.1% |
| Blackfeet | 0.3 /100 | #273 | Tragic 12.1% |
| Cape Verdeans | 0.3 /100 | #274 | Tragic 12.1% |
| Cubans | 0.3 /100 | #275 | Tragic 12.1% |
| Blacks/African Americans | 0.3 /100 | #276 | Tragic 12.1% |
| Immigrants | Caribbean | 0.3 /100 | #277 | Tragic 12.1% |
| Potawatomi | 0.3 /100 | #278 | Tragic 12.1% |
| Immigrants | Belize | 0.2 /100 | #279 | Tragic 12.1% |
| Immigrants | Dominican Republic | 0.2 /100 | #280 | Tragic 12.1% |
| Malaysians | 0.2 /100 | #281 | Tragic 12.0% |
| Immigrants | El Salvador | 0.2 /100 | #282 | Tragic 12.0% |
| Hondurans | 0.2 /100 | #283 | Tragic 11.9% |
| Ottawa | 0.2 /100 | #284 | Tragic 11.9% |