Immigrants from Argentina vs Mongolian Master's Degree
COMPARE
Immigrants from Argentina
Mongolian
Master's Degree
Master's Degree Comparison
Immigrants from Argentina
Mongolians
18.0%
MASTER'S DEGREE
99.8/ 100
METRIC RATING
67th/ 347
METRIC RANK
19.4%
MASTER'S DEGREE
100.0/ 100
METRIC RATING
37th/ 347
METRIC RANK
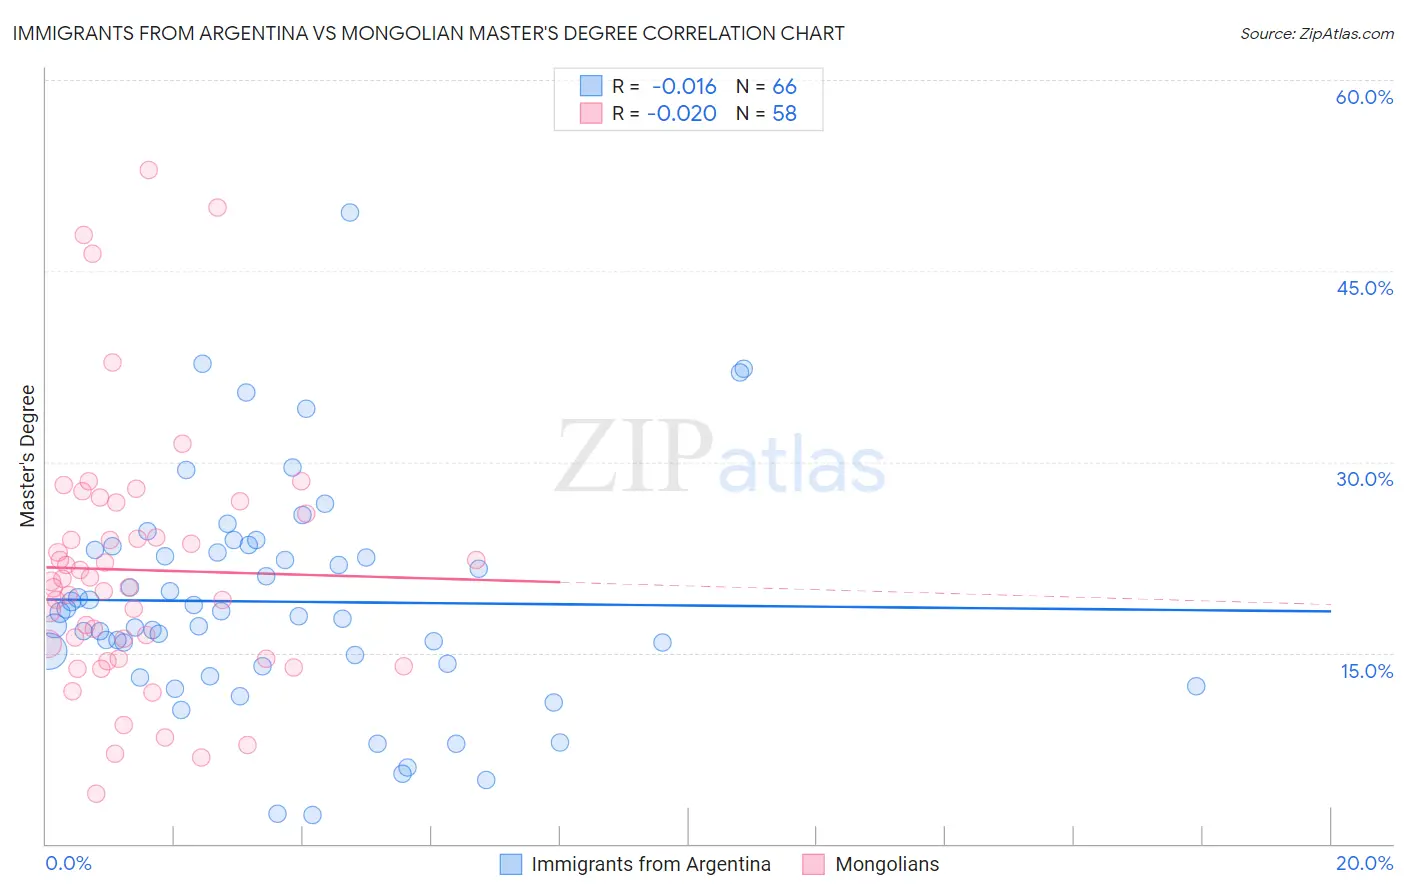
Immigrants from Argentina vs Mongolian Master's Degree Correlation Chart
The statistical analysis conducted on geographies consisting of 264,373,397 people shows no correlation between the proportion of Immigrants from Argentina and percentage of population with at least master's degree education in the United States with a correlation coefficient (R) of -0.016 and weighted average of 18.0%. Similarly, the statistical analysis conducted on geographies consisting of 140,335,319 people shows no correlation between the proportion of Mongolians and percentage of population with at least master's degree education in the United States with a correlation coefficient (R) of -0.020 and weighted average of 19.4%, a difference of 8.0%.
Master's Degree Correlation Summary
| Measurement | Immigrants from Argentina | Mongolian |
| Minimum | 2.2% | 3.9% |
| Maximum | 49.6% | 53.0% |
| Range | 47.3% | 49.0% |
| Mean | 19.0% | 21.5% |
| Median | 18.0% | 20.4% |
| Interquartile 25% (IQ1) | 14.1% | 14.5% |
| Interquartile 75% (IQ3) | 23.1% | 26.0% |
| Interquartile Range (IQR) | 9.0% | 11.4% |
| Standard Deviation (Sample) | 8.8% | 10.1% |
| Standard Deviation (Population) | 8.7% | 10.0% |
Similar Demographics by Master's Degree
Demographics Similar to Immigrants from Argentina by Master's Degree
In terms of master's degree, the demographic groups most similar to Immigrants from Argentina are Ethiopian (18.0%, a difference of 0.050%), Immigrants from Kazakhstan (18.0%, a difference of 0.070%), Immigrants from Ethiopia (17.9%, a difference of 0.23%), Immigrants from Uzbekistan (17.9%, a difference of 0.55%), and Immigrants from Western Europe (17.8%, a difference of 0.77%).
| Demographics | Rating | Rank | Master's Degree |
| New Zealanders | 99.9 /100 | #60 | Exceptional 18.3% |
| Immigrants | Europe | 99.9 /100 | #61 | Exceptional 18.2% |
| Argentineans | 99.9 /100 | #62 | Exceptional 18.2% |
| Immigrants | Netherlands | 99.9 /100 | #63 | Exceptional 18.1% |
| South Africans | 99.9 /100 | #64 | Exceptional 18.1% |
| Immigrants | Kazakhstan | 99.8 /100 | #65 | Exceptional 18.0% |
| Ethiopians | 99.8 /100 | #66 | Exceptional 18.0% |
| Immigrants | Argentina | 99.8 /100 | #67 | Exceptional 18.0% |
| Immigrants | Ethiopia | 99.8 /100 | #68 | Exceptional 17.9% |
| Immigrants | Uzbekistan | 99.8 /100 | #69 | Exceptional 17.9% |
| Immigrants | Western Europe | 99.8 /100 | #70 | Exceptional 17.8% |
| Immigrants | Pakistan | 99.7 /100 | #71 | Exceptional 17.8% |
| Lithuanians | 99.7 /100 | #72 | Exceptional 17.7% |
| Zimbabweans | 99.7 /100 | #73 | Exceptional 17.7% |
| Immigrants | Romania | 99.7 /100 | #74 | Exceptional 17.7% |
Demographics Similar to Mongolians by Master's Degree
In terms of master's degree, the demographic groups most similar to Mongolians are Immigrants from Russia (19.4%, a difference of 0.040%), Immigrants from Northern Europe (19.5%, a difference of 0.41%), Bolivian (19.3%, a difference of 0.69%), Immigrants from Denmark (19.5%, a difference of 0.74%), and Russian (19.5%, a difference of 0.77%).
| Demographics | Rating | Rank | Master's Degree |
| Immigrants | Turkey | 100.0 /100 | #30 | Exceptional 19.7% |
| Immigrants | Korea | 100.0 /100 | #31 | Exceptional 19.7% |
| Burmese | 100.0 /100 | #32 | Exceptional 19.7% |
| Russians | 100.0 /100 | #33 | Exceptional 19.5% |
| Immigrants | Denmark | 100.0 /100 | #34 | Exceptional 19.5% |
| Immigrants | Northern Europe | 100.0 /100 | #35 | Exceptional 19.5% |
| Immigrants | Russia | 100.0 /100 | #36 | Exceptional 19.4% |
| Mongolians | 100.0 /100 | #37 | Exceptional 19.4% |
| Bolivians | 100.0 /100 | #38 | Exceptional 19.3% |
| Immigrants | Spain | 100.0 /100 | #39 | Exceptional 19.1% |
| Immigrants | Bolivia | 100.0 /100 | #40 | Exceptional 19.1% |
| Immigrants | Latvia | 100.0 /100 | #41 | Exceptional 19.1% |
| Immigrants | Saudi Arabia | 100.0 /100 | #42 | Exceptional 19.0% |
| Immigrants | Greece | 100.0 /100 | #43 | Exceptional 19.0% |
| Immigrants | Malaysia | 100.0 /100 | #44 | Exceptional 18.9% |