Immigrants from Iraq vs Mongolian Master's Degree
COMPARE
Immigrants from Iraq
Mongolian
Master's Degree
Master's Degree Comparison
Immigrants from Iraq
Mongolians
14.8%
MASTER'S DEGREE
41.3/ 100
METRIC RATING
179th/ 347
METRIC RANK
19.4%
MASTER'S DEGREE
100.0/ 100
METRIC RATING
37th/ 347
METRIC RANK
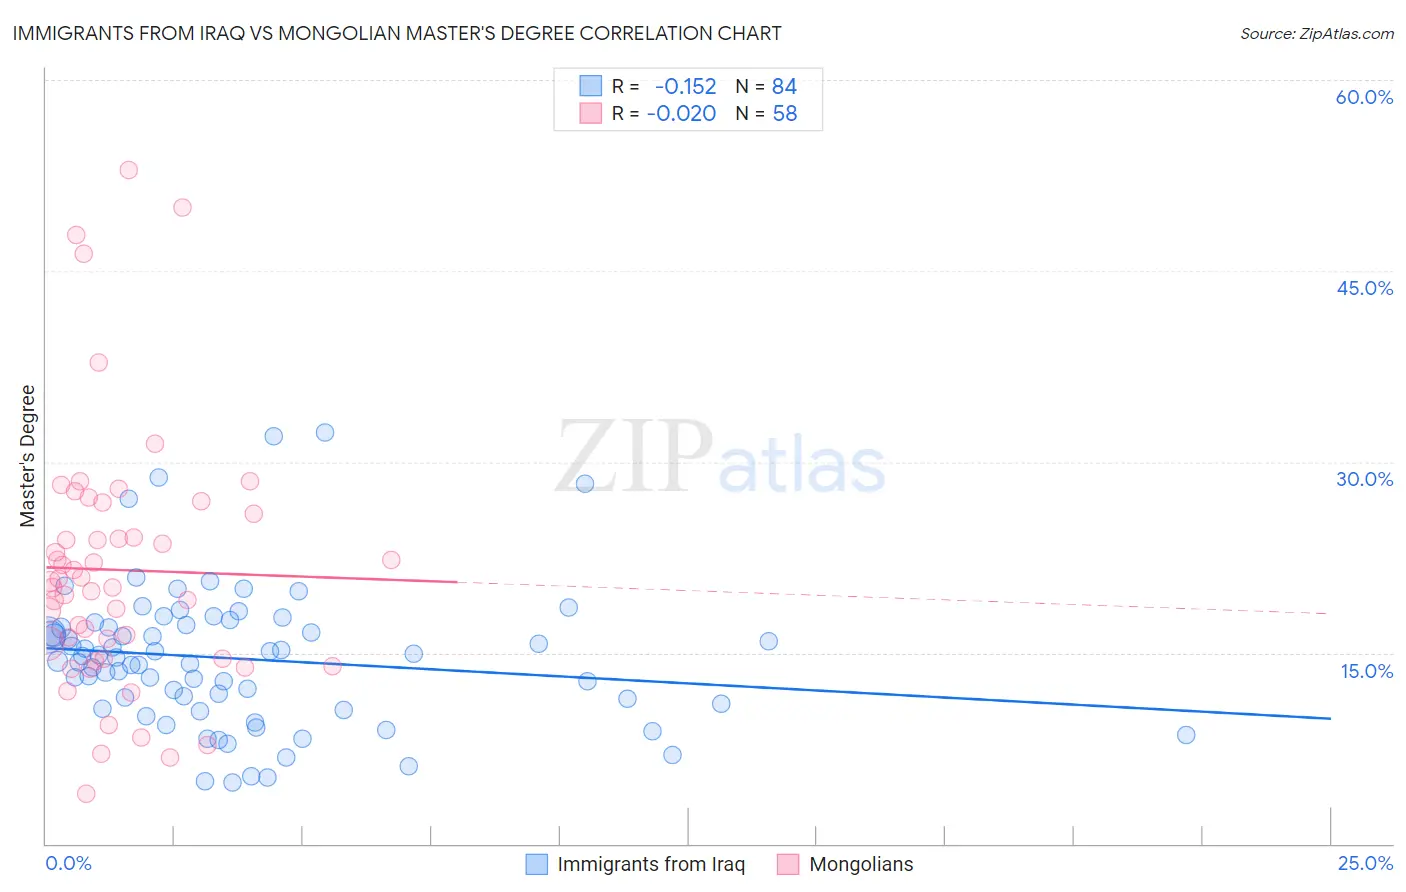
Immigrants from Iraq vs Mongolian Master's Degree Correlation Chart
The statistical analysis conducted on geographies consisting of 194,768,145 people shows a poor negative correlation between the proportion of Immigrants from Iraq and percentage of population with at least master's degree education in the United States with a correlation coefficient (R) of -0.152 and weighted average of 14.8%. Similarly, the statistical analysis conducted on geographies consisting of 140,335,319 people shows no correlation between the proportion of Mongolians and percentage of population with at least master's degree education in the United States with a correlation coefficient (R) of -0.020 and weighted average of 19.4%, a difference of 31.5%.
Master's Degree Correlation Summary
| Measurement | Immigrants from Iraq | Mongolian |
| Minimum | 4.8% | 3.9% |
| Maximum | 32.3% | 53.0% |
| Range | 27.5% | 49.0% |
| Mean | 14.5% | 21.5% |
| Median | 14.5% | 20.4% |
| Interquartile 25% (IQ1) | 10.8% | 14.5% |
| Interquartile 75% (IQ3) | 17.1% | 26.0% |
| Interquartile Range (IQR) | 6.3% | 11.4% |
| Standard Deviation (Sample) | 5.6% | 10.1% |
| Standard Deviation (Population) | 5.5% | 10.0% |
Similar Demographics by Master's Degree
Demographics Similar to Immigrants from Iraq by Master's Degree
In terms of master's degree, the demographic groups most similar to Immigrants from Iraq are Celtic (14.8%, a difference of 0.010%), Swiss (14.7%, a difference of 0.030%), Czech (14.7%, a difference of 0.13%), Sri Lankan (14.7%, a difference of 0.23%), and Immigrants from Zaire (14.7%, a difference of 0.25%).
| Demographics | Rating | Rank | Master's Degree |
| Immigrants | Uruguay | 52.8 /100 | #172 | Average 15.0% |
| Costa Ricans | 52.5 /100 | #173 | Average 15.0% |
| Slovaks | 50.0 /100 | #174 | Average 14.9% |
| Immigrants | Peru | 49.6 /100 | #175 | Average 14.9% |
| Nigerians | 48.6 /100 | #176 | Average 14.9% |
| Immigrants | Colombia | 48.3 /100 | #177 | Average 14.9% |
| English | 45.0 /100 | #178 | Average 14.8% |
| Immigrants | Iraq | 41.3 /100 | #179 | Average 14.8% |
| Celtics | 41.3 /100 | #180 | Average 14.8% |
| Swiss | 41.1 /100 | #181 | Average 14.7% |
| Czechs | 40.4 /100 | #182 | Average 14.7% |
| Sri Lankans | 39.6 /100 | #183 | Fair 14.7% |
| Immigrants | Zaire | 39.5 /100 | #184 | Fair 14.7% |
| Barbadians | 38.3 /100 | #185 | Fair 14.7% |
| Immigrants | Oceania | 37.1 /100 | #186 | Fair 14.7% |
Demographics Similar to Mongolians by Master's Degree
In terms of master's degree, the demographic groups most similar to Mongolians are Immigrants from Russia (19.4%, a difference of 0.040%), Immigrants from Northern Europe (19.5%, a difference of 0.41%), Bolivian (19.3%, a difference of 0.69%), Immigrants from Denmark (19.5%, a difference of 0.74%), and Russian (19.5%, a difference of 0.77%).
| Demographics | Rating | Rank | Master's Degree |
| Immigrants | Turkey | 100.0 /100 | #30 | Exceptional 19.7% |
| Immigrants | Korea | 100.0 /100 | #31 | Exceptional 19.7% |
| Burmese | 100.0 /100 | #32 | Exceptional 19.7% |
| Russians | 100.0 /100 | #33 | Exceptional 19.5% |
| Immigrants | Denmark | 100.0 /100 | #34 | Exceptional 19.5% |
| Immigrants | Northern Europe | 100.0 /100 | #35 | Exceptional 19.5% |
| Immigrants | Russia | 100.0 /100 | #36 | Exceptional 19.4% |
| Mongolians | 100.0 /100 | #37 | Exceptional 19.4% |
| Bolivians | 100.0 /100 | #38 | Exceptional 19.3% |
| Immigrants | Spain | 100.0 /100 | #39 | Exceptional 19.1% |
| Immigrants | Bolivia | 100.0 /100 | #40 | Exceptional 19.1% |
| Immigrants | Latvia | 100.0 /100 | #41 | Exceptional 19.1% |
| Immigrants | Saudi Arabia | 100.0 /100 | #42 | Exceptional 19.0% |
| Immigrants | Greece | 100.0 /100 | #43 | Exceptional 19.0% |
| Immigrants | Malaysia | 100.0 /100 | #44 | Exceptional 18.9% |