Pima vs Mongolian Master's Degree
COMPARE
Pima
Mongolian
Master's Degree
Master's Degree Comparison
Pima
Mongolians
9.2%
MASTER'S DEGREE
0.0/ 100
METRIC RATING
344th/ 347
METRIC RANK
19.4%
MASTER'S DEGREE
100.0/ 100
METRIC RATING
37th/ 347
METRIC RANK
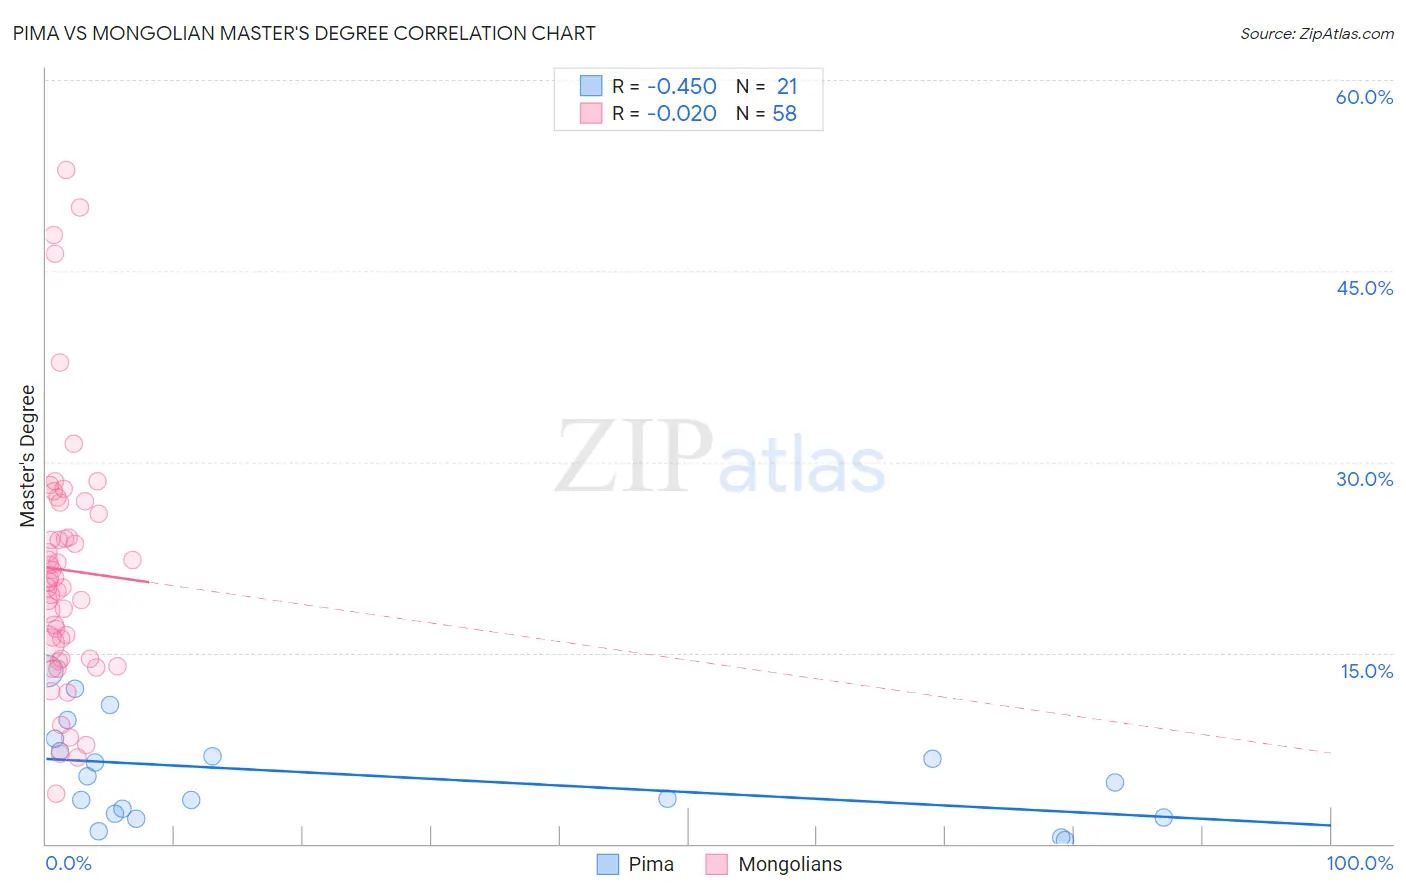
Pima vs Mongolian Master's Degree Correlation Chart
The statistical analysis conducted on geographies consisting of 61,537,542 people shows a moderate negative correlation between the proportion of Pima and percentage of population with at least master's degree education in the United States with a correlation coefficient (R) of -0.450 and weighted average of 9.2%. Similarly, the statistical analysis conducted on geographies consisting of 140,335,319 people shows no correlation between the proportion of Mongolians and percentage of population with at least master's degree education in the United States with a correlation coefficient (R) of -0.020 and weighted average of 19.4%, a difference of 109.7%.
Master's Degree Correlation Summary
| Measurement | Pima | Mongolian |
| Minimum | 0.28% | 3.9% |
| Maximum | 13.6% | 53.0% |
| Range | 13.3% | 49.0% |
| Mean | 5.4% | 21.5% |
| Median | 4.8% | 20.4% |
| Interquartile 25% (IQ1) | 2.2% | 14.5% |
| Interquartile 75% (IQ3) | 7.8% | 26.0% |
| Interquartile Range (IQR) | 5.6% | 11.4% |
| Standard Deviation (Sample) | 3.9% | 10.1% |
| Standard Deviation (Population) | 3.8% | 10.0% |
Similar Demographics by Master's Degree
Demographics Similar to Pima by Master's Degree
In terms of master's degree, the demographic groups most similar to Pima are Yuman (9.2%, a difference of 0.15%), Lumbee (9.3%, a difference of 0.17%), Immigrants from Mexico (9.3%, a difference of 0.65%), Navajo (9.4%, a difference of 1.9%), and Yakama (9.5%, a difference of 2.3%).
| Demographics | Rating | Rank | Master's Degree |
| Menominee | 0.0 /100 | #333 | Tragic 10.2% |
| Arapaho | 0.0 /100 | #334 | Tragic 10.0% |
| Immigrants | Central America | 0.0 /100 | #335 | Tragic 10.0% |
| Natives/Alaskans | 0.0 /100 | #336 | Tragic 9.9% |
| Mexicans | 0.0 /100 | #337 | Tragic 9.7% |
| Tohono O'odham | 0.0 /100 | #338 | Tragic 9.7% |
| Spanish American Indians | 0.0 /100 | #339 | Tragic 9.6% |
| Yakama | 0.0 /100 | #340 | Tragic 9.5% |
| Navajo | 0.0 /100 | #341 | Tragic 9.4% |
| Immigrants | Mexico | 0.0 /100 | #342 | Tragic 9.3% |
| Lumbee | 0.0 /100 | #343 | Tragic 9.3% |
| Pima | 0.0 /100 | #344 | Tragic 9.2% |
| Yuman | 0.0 /100 | #345 | Tragic 9.2% |
| Yup'ik | 0.0 /100 | #346 | Tragic 8.5% |
| Houma | 0.0 /100 | #347 | Tragic 7.9% |
Demographics Similar to Mongolians by Master's Degree
In terms of master's degree, the demographic groups most similar to Mongolians are Immigrants from Russia (19.4%, a difference of 0.040%), Immigrants from Northern Europe (19.5%, a difference of 0.41%), Bolivian (19.3%, a difference of 0.69%), Immigrants from Denmark (19.5%, a difference of 0.74%), and Russian (19.5%, a difference of 0.77%).
| Demographics | Rating | Rank | Master's Degree |
| Immigrants | Turkey | 100.0 /100 | #30 | Exceptional 19.7% |
| Immigrants | Korea | 100.0 /100 | #31 | Exceptional 19.7% |
| Burmese | 100.0 /100 | #32 | Exceptional 19.7% |
| Russians | 100.0 /100 | #33 | Exceptional 19.5% |
| Immigrants | Denmark | 100.0 /100 | #34 | Exceptional 19.5% |
| Immigrants | Northern Europe | 100.0 /100 | #35 | Exceptional 19.5% |
| Immigrants | Russia | 100.0 /100 | #36 | Exceptional 19.4% |
| Mongolians | 100.0 /100 | #37 | Exceptional 19.4% |
| Bolivians | 100.0 /100 | #38 | Exceptional 19.3% |
| Immigrants | Spain | 100.0 /100 | #39 | Exceptional 19.1% |
| Immigrants | Bolivia | 100.0 /100 | #40 | Exceptional 19.1% |
| Immigrants | Latvia | 100.0 /100 | #41 | Exceptional 19.1% |
| Immigrants | Saudi Arabia | 100.0 /100 | #42 | Exceptional 19.0% |
| Immigrants | Greece | 100.0 /100 | #43 | Exceptional 19.0% |
| Immigrants | Malaysia | 100.0 /100 | #44 | Exceptional 18.9% |