Croatian vs Immigrants from Moldova 6th Grade
COMPARE
Croatian
Immigrants from Moldova
6th Grade
6th Grade Comparison
Croatians
Immigrants from Moldova
98.0%
6TH GRADE
100.0/ 100
METRIC RATING
24th/ 347
METRIC RANK
97.3%
6TH GRADE
90.0/ 100
METRIC RATING
133rd/ 347
METRIC RANK
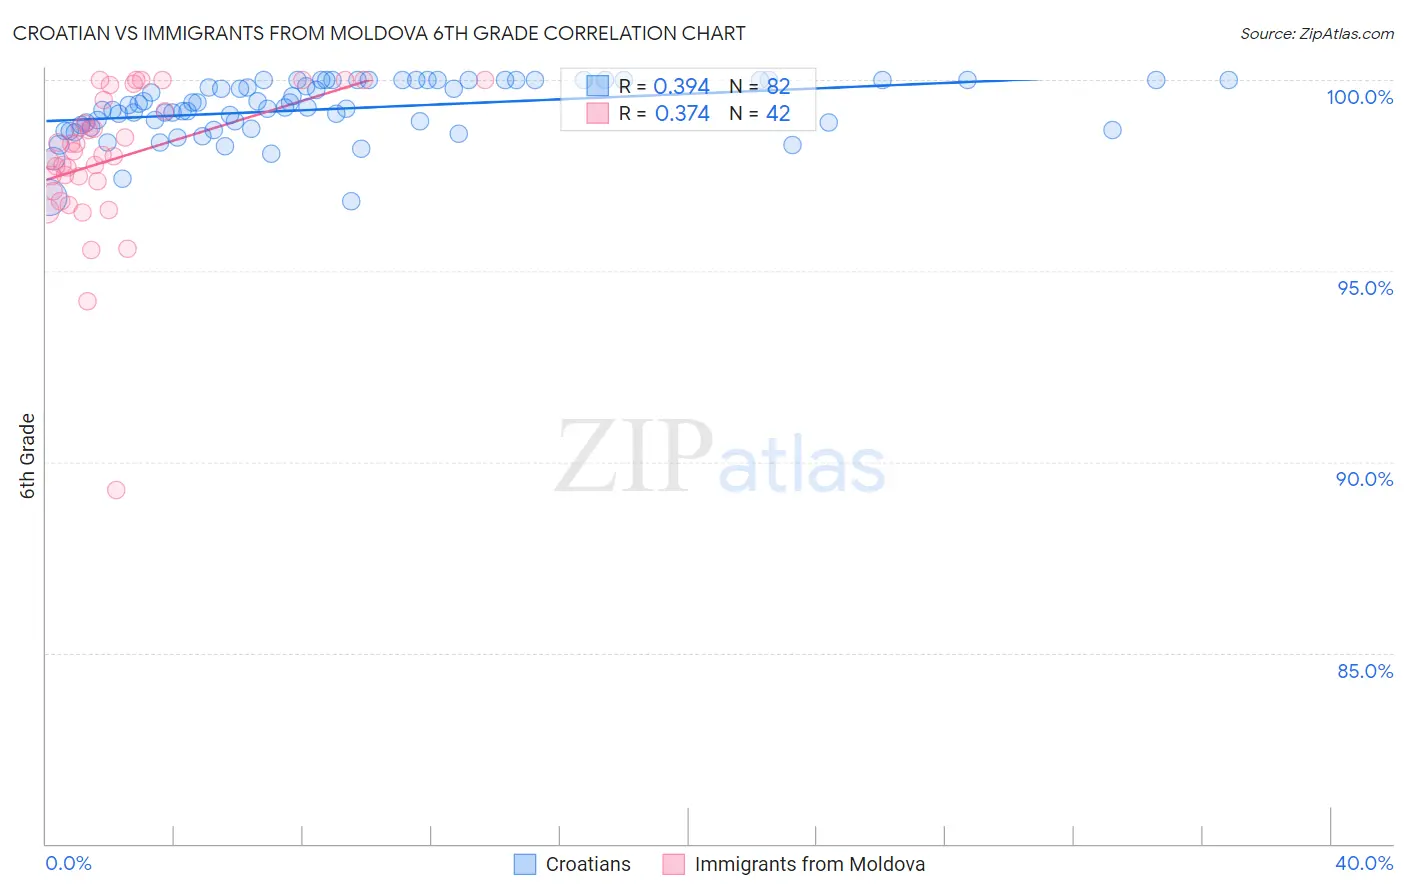
Croatian vs Immigrants from Moldova 6th Grade Correlation Chart
The statistical analysis conducted on geographies consisting of 375,733,612 people shows a mild positive correlation between the proportion of Croatians and percentage of population with at least 6th grade education in the United States with a correlation coefficient (R) of 0.394 and weighted average of 98.0%. Similarly, the statistical analysis conducted on geographies consisting of 124,396,843 people shows a mild positive correlation between the proportion of Immigrants from Moldova and percentage of population with at least 6th grade education in the United States with a correlation coefficient (R) of 0.374 and weighted average of 97.3%, a difference of 0.76%.
6th Grade Correlation Summary
| Measurement | Croatian | Immigrants from Moldova |
| Minimum | 96.8% | 89.3% |
| Maximum | 100.0% | 100.0% |
| Range | 3.2% | 10.7% |
| Mean | 99.2% | 98.0% |
| Median | 99.3% | 98.1% |
| Interquartile 25% (IQ1) | 98.8% | 97.3% |
| Interquartile 75% (IQ3) | 100.0% | 99.5% |
| Interquartile Range (IQR) | 1.2% | 2.2% |
| Standard Deviation (Sample) | 0.74% | 2.0% |
| Standard Deviation (Population) | 0.73% | 2.0% |
Similar Demographics by 6th Grade
Demographics Similar to Croatians by 6th Grade
In terms of 6th grade, the demographic groups most similar to Croatians are Danish (98.0%, a difference of 0.010%), Sioux (98.0%, a difference of 0.010%), Scotch-Irish (98.0%, a difference of 0.010%), Czech (98.0%, a difference of 0.020%), and Lithuanian (98.1%, a difference of 0.030%).
| Demographics | Rating | Rank | 6th Grade |
| Poles | 100.0 /100 | #17 | Exceptional 98.1% |
| Pennsylvania Germans | 100.0 /100 | #18 | Exceptional 98.1% |
| Irish | 100.0 /100 | #19 | Exceptional 98.1% |
| Finns | 100.0 /100 | #20 | Exceptional 98.1% |
| Lithuanians | 100.0 /100 | #21 | Exceptional 98.1% |
| Danes | 100.0 /100 | #22 | Exceptional 98.0% |
| Sioux | 100.0 /100 | #23 | Exceptional 98.0% |
| Croatians | 100.0 /100 | #24 | Exceptional 98.0% |
| Scotch-Irish | 100.0 /100 | #25 | Exceptional 98.0% |
| Czechs | 100.0 /100 | #26 | Exceptional 98.0% |
| Yup'ik | 100.0 /100 | #27 | Exceptional 98.0% |
| Scandinavians | 100.0 /100 | #28 | Exceptional 98.0% |
| French | 100.0 /100 | #29 | Exceptional 98.0% |
| French Canadians | 100.0 /100 | #30 | Exceptional 98.0% |
| Europeans | 100.0 /100 | #31 | Exceptional 98.0% |
Demographics Similar to Immigrants from Moldova by 6th Grade
In terms of 6th grade, the demographic groups most similar to Immigrants from Moldova are Immigrants from Europe (97.3%, a difference of 0.010%), Palestinian (97.3%, a difference of 0.010%), Immigrants from Kuwait (97.3%, a difference of 0.010%), Immigrants from Hungary (97.3%, a difference of 0.010%), and Filipino (97.3%, a difference of 0.010%).
| Demographics | Rating | Rank | 6th Grade |
| Immigrants | Bulgaria | 93.6 /100 | #126 | Exceptional 97.3% |
| Immigrants | Croatia | 93.1 /100 | #127 | Exceptional 97.3% |
| Immigrants | Romania | 92.0 /100 | #128 | Exceptional 97.3% |
| Immigrants | Serbia | 91.9 /100 | #129 | Exceptional 97.3% |
| Cambodians | 91.8 /100 | #130 | Exceptional 97.3% |
| Immigrants | Europe | 91.1 /100 | #131 | Exceptional 97.3% |
| Palestinians | 90.9 /100 | #132 | Exceptional 97.3% |
| Immigrants | Moldova | 90.0 /100 | #133 | Excellent 97.3% |
| Immigrants | Kuwait | 89.5 /100 | #134 | Excellent 97.3% |
| Immigrants | Hungary | 89.5 /100 | #135 | Excellent 97.3% |
| Filipinos | 88.9 /100 | #136 | Excellent 97.3% |
| Burmese | 87.8 /100 | #137 | Excellent 97.3% |
| Blackfeet | 87.7 /100 | #138 | Excellent 97.3% |
| Immigrants | Turkey | 86.1 /100 | #139 | Excellent 97.3% |
| Immigrants | North Macedonia | 85.5 /100 | #140 | Excellent 97.2% |