Albanian vs Aleut College, 1 year or more
COMPARE
Albanian
Aleut
College, 1 year or more
College, 1 year or more Comparison
Albanians
Aleuts
60.4%
COLLEGE, 1 YEAR OR MORE
77.8/ 100
METRIC RATING
151st/ 347
METRIC RANK
55.4%
COLLEGE, 1 YEAR OR MORE
0.6/ 100
METRIC RATING
252nd/ 347
METRIC RANK
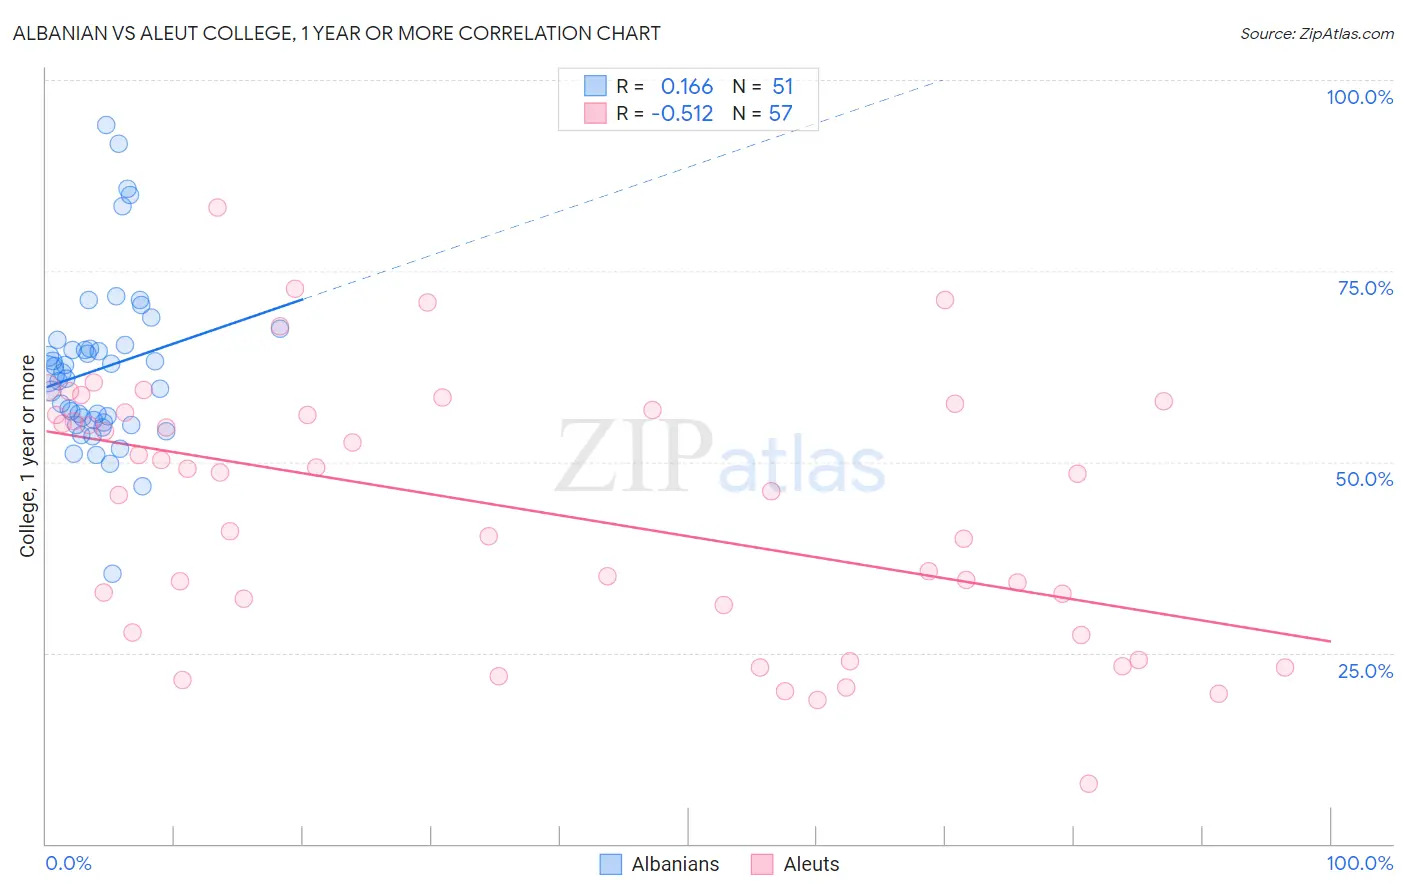
Albanian vs Aleut College, 1 year or more Correlation Chart
The statistical analysis conducted on geographies consisting of 193,265,709 people shows a poor positive correlation between the proportion of Albanians and percentage of population with at least college, 1 year or more education in the United States with a correlation coefficient (R) of 0.166 and weighted average of 60.4%. Similarly, the statistical analysis conducted on geographies consisting of 61,782,916 people shows a substantial negative correlation between the proportion of Aleuts and percentage of population with at least college, 1 year or more education in the United States with a correlation coefficient (R) of -0.512 and weighted average of 55.4%, a difference of 9.0%.
College, 1 year or more Correlation Summary
| Measurement | Albanian | Aleut |
| Minimum | 35.4% | 7.9% |
| Maximum | 94.1% | 83.3% |
| Range | 58.7% | 75.4% |
| Mean | 62.2% | 43.9% |
| Median | 61.5% | 48.5% |
| Interquartile 25% (IQ1) | 55.2% | 29.5% |
| Interquartile 75% (IQ3) | 65.3% | 56.7% |
| Interquartile Range (IQR) | 10.1% | 27.2% |
| Standard Deviation (Sample) | 11.0% | 16.9% |
| Standard Deviation (Population) | 10.9% | 16.7% |
Similar Demographics by College, 1 year or more
Demographics Similar to Albanians by College, 1 year or more
In terms of college, 1 year or more, the demographic groups most similar to Albanians are Immigrants from Sudan (60.4%, a difference of 0.0%), Kenyan (60.5%, a difference of 0.090%), Brazilian (60.5%, a difference of 0.090%), Immigrants from Kenya (60.5%, a difference of 0.10%), and Immigrants from Germany (60.3%, a difference of 0.13%).
| Demographics | Rating | Rank | College, 1 year or more |
| Czechs | 81.9 /100 | #144 | Excellent 60.6% |
| Slavs | 81.1 /100 | #145 | Excellent 60.6% |
| Scottish | 80.2 /100 | #146 | Excellent 60.5% |
| Immigrants | Kenya | 79.1 /100 | #147 | Good 60.5% |
| Kenyans | 79.0 /100 | #148 | Good 60.5% |
| Brazilians | 79.0 /100 | #149 | Good 60.5% |
| Immigrants | Sudan | 77.8 /100 | #150 | Good 60.4% |
| Albanians | 77.8 /100 | #151 | Good 60.4% |
| Immigrants | Germany | 76.1 /100 | #152 | Good 60.3% |
| Sierra Leoneans | 74.1 /100 | #153 | Good 60.2% |
| Sudanese | 73.0 /100 | #154 | Good 60.2% |
| Moroccans | 72.9 /100 | #155 | Good 60.2% |
| Finns | 72.9 /100 | #156 | Good 60.2% |
| Immigrants | Armenia | 68.8 /100 | #157 | Good 60.0% |
| English | 67.2 /100 | #158 | Good 60.0% |
Demographics Similar to Aleuts by College, 1 year or more
In terms of college, 1 year or more, the demographic groups most similar to Aleuts are Immigrants from Cambodia (55.4%, a difference of 0.030%), Immigrants from Barbados (55.4%, a difference of 0.11%), Delaware (55.5%, a difference of 0.12%), Immigrants from Trinidad and Tobago (55.5%, a difference of 0.14%), and Immigrants from Congo (55.6%, a difference of 0.24%).
| Demographics | Rating | Rank | College, 1 year or more |
| Immigrants | Liberia | 0.8 /100 | #245 | Tragic 55.7% |
| Malaysians | 0.8 /100 | #246 | Tragic 55.6% |
| Hawaiians | 0.8 /100 | #247 | Tragic 55.6% |
| Immigrants | Congo | 0.8 /100 | #248 | Tragic 55.6% |
| Immigrants | Trinidad and Tobago | 0.7 /100 | #249 | Tragic 55.5% |
| Delaware | 0.7 /100 | #250 | Tragic 55.5% |
| Immigrants | Cambodia | 0.6 /100 | #251 | Tragic 55.4% |
| Aleuts | 0.6 /100 | #252 | Tragic 55.4% |
| Immigrants | Barbados | 0.6 /100 | #253 | Tragic 55.4% |
| Japanese | 0.5 /100 | #254 | Tragic 55.2% |
| Immigrants | Bahamas | 0.5 /100 | #255 | Tragic 55.2% |
| Immigrants | West Indies | 0.5 /100 | #256 | Tragic 55.2% |
| Indonesians | 0.4 /100 | #257 | Tragic 55.1% |
| Africans | 0.4 /100 | #258 | Tragic 55.0% |
| Nepalese | 0.3 /100 | #259 | Tragic 54.9% |