Immigrants from Japan vs Aleut College, 1 year or more
COMPARE
Immigrants from Japan
Aleut
College, 1 year or more
College, 1 year or more Comparison
Immigrants from Japan
Aleuts
66.7%
COLLEGE, 1 YEAR OR MORE
100.0/ 100
METRIC RATING
16th/ 347
METRIC RANK
55.4%
COLLEGE, 1 YEAR OR MORE
0.6/ 100
METRIC RATING
252nd/ 347
METRIC RANK
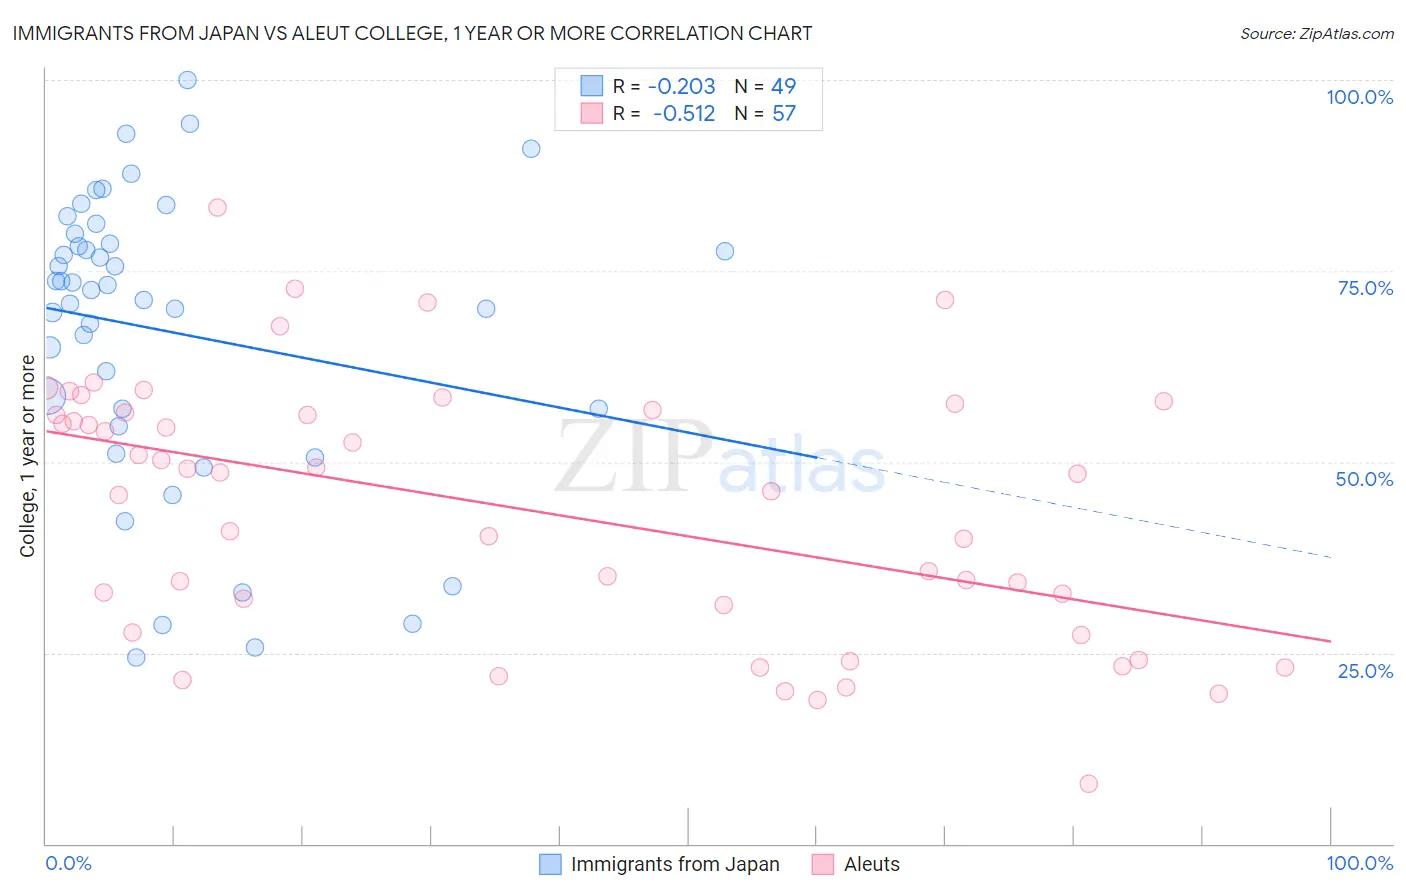
Immigrants from Japan vs Aleut College, 1 year or more Correlation Chart
The statistical analysis conducted on geographies consisting of 340,147,719 people shows a weak negative correlation between the proportion of Immigrants from Japan and percentage of population with at least college, 1 year or more education in the United States with a correlation coefficient (R) of -0.203 and weighted average of 66.7%. Similarly, the statistical analysis conducted on geographies consisting of 61,782,916 people shows a substantial negative correlation between the proportion of Aleuts and percentage of population with at least college, 1 year or more education in the United States with a correlation coefficient (R) of -0.512 and weighted average of 55.4%, a difference of 20.3%.
College, 1 year or more Correlation Summary
| Measurement | Immigrants from Japan | Aleut |
| Minimum | 24.4% | 7.9% |
| Maximum | 100.0% | 83.3% |
| Range | 75.6% | 75.4% |
| Mean | 67.0% | 43.9% |
| Median | 72.5% | 48.5% |
| Interquartile 25% (IQ1) | 55.8% | 29.5% |
| Interquartile 75% (IQ3) | 79.2% | 56.7% |
| Interquartile Range (IQR) | 23.4% | 27.2% |
| Standard Deviation (Sample) | 19.1% | 16.9% |
| Standard Deviation (Population) | 18.9% | 16.7% |
Similar Demographics by College, 1 year or more
Demographics Similar to Immigrants from Japan by College, 1 year or more
In terms of college, 1 year or more, the demographic groups most similar to Immigrants from Japan are Cambodian (66.7%, a difference of 0.030%), Burmese (66.7%, a difference of 0.040%), Immigrants from Eastern Asia (66.6%, a difference of 0.11%), Eastern European (66.6%, a difference of 0.19%), and Immigrants from Sweden (66.8%, a difference of 0.23%).
| Demographics | Rating | Rank | College, 1 year or more |
| Immigrants | Israel | 100.0 /100 | #9 | Exceptional 67.8% |
| Immigrants | Australia | 100.0 /100 | #10 | Exceptional 67.7% |
| Immigrants | South Central Asia | 100.0 /100 | #11 | Exceptional 67.1% |
| Cypriots | 100.0 /100 | #12 | Exceptional 67.0% |
| Immigrants | Sweden | 100.0 /100 | #13 | Exceptional 66.8% |
| Burmese | 100.0 /100 | #14 | Exceptional 66.7% |
| Cambodians | 100.0 /100 | #15 | Exceptional 66.7% |
| Immigrants | Japan | 100.0 /100 | #16 | Exceptional 66.7% |
| Immigrants | Eastern Asia | 100.0 /100 | #17 | Exceptional 66.6% |
| Eastern Europeans | 100.0 /100 | #18 | Exceptional 66.6% |
| Immigrants | Switzerland | 100.0 /100 | #19 | Exceptional 66.5% |
| Immigrants | Korea | 100.0 /100 | #20 | Exceptional 66.5% |
| Immigrants | Hong Kong | 100.0 /100 | #21 | Exceptional 66.4% |
| Soviet Union | 100.0 /100 | #22 | Exceptional 66.4% |
| Immigrants | China | 100.0 /100 | #23 | Exceptional 66.4% |
Demographics Similar to Aleuts by College, 1 year or more
In terms of college, 1 year or more, the demographic groups most similar to Aleuts are Immigrants from Cambodia (55.4%, a difference of 0.030%), Immigrants from Barbados (55.4%, a difference of 0.11%), Delaware (55.5%, a difference of 0.12%), Immigrants from Trinidad and Tobago (55.5%, a difference of 0.14%), and Immigrants from Congo (55.6%, a difference of 0.24%).
| Demographics | Rating | Rank | College, 1 year or more |
| Immigrants | Liberia | 0.8 /100 | #245 | Tragic 55.7% |
| Malaysians | 0.8 /100 | #246 | Tragic 55.6% |
| Hawaiians | 0.8 /100 | #247 | Tragic 55.6% |
| Immigrants | Congo | 0.8 /100 | #248 | Tragic 55.6% |
| Immigrants | Trinidad and Tobago | 0.7 /100 | #249 | Tragic 55.5% |
| Delaware | 0.7 /100 | #250 | Tragic 55.5% |
| Immigrants | Cambodia | 0.6 /100 | #251 | Tragic 55.4% |
| Aleuts | 0.6 /100 | #252 | Tragic 55.4% |
| Immigrants | Barbados | 0.6 /100 | #253 | Tragic 55.4% |
| Japanese | 0.5 /100 | #254 | Tragic 55.2% |
| Immigrants | Bahamas | 0.5 /100 | #255 | Tragic 55.2% |
| Immigrants | West Indies | 0.5 /100 | #256 | Tragic 55.2% |
| Indonesians | 0.4 /100 | #257 | Tragic 55.1% |
| Africans | 0.4 /100 | #258 | Tragic 55.0% |
| Nepalese | 0.3 /100 | #259 | Tragic 54.9% |